Gas Supply Hub active participants – Moomba

Tabs

Graph
Data
QuarterExport/producer (Average monthly participant count)Gentail/GPG (Average monthly participant count)Industrial (Average monthly participant count)Trader (Average monthly participant count)
2016 Q31.331.670.000.00
2016 Q41.002.000.000.00
2017 Q11.002.000.000.00
2017 Q21.502.000.000.00
2017 Q30.002.670.000.00
2017 Q41.002.330.000.00
2018 Q11.002.330.000.00
2018 Q21.002.330.000.00
2018 Q31.672.330.000.00
2018 Q41.502.670.000.00
2019 Q11.003.330.000.00
2019 Q22.003.000.001.00
2019 Q31.672.670.001.00
2019 Q41.673.330.001.00
2020 Q11.332.000.001.00
2020 Q21.001.330.001.00
2020 Q31.002.000.001.00
2020 Q41.001.670.001.33
2021 Q11.001.670.001.00
2021 Q21.002.000.000.00
2021 Q31.001.670.000.00
2021 Q41.671.330.001.00
2022 Q12.672.001.001.00
2022 Q22.001.330.001.50
2022 Q31.671.331.001.00
2022 Q41.331.001.001.00
Download data as CSV
Information
Sector: 
Segment: 
Category: 
Gas liquidity (GSH)
AER reference: 
D11/2298801[V6]
Source: 
AER; AEMO
Overview: 

To supplement the voluntary gas supply hub located at Wallumbilla, the Moomba hub was established from 1 June 2016 to facilitate trade on the Moomba to Adelaide Pipeline (MAP) and Moomba to Sydney Pipeline (MSP). A spread product also allows for trading between the Wallumbilla and Moomba markets on the SWQP (representing the price differential between the two hubs at the MSP and WAL trading locations).

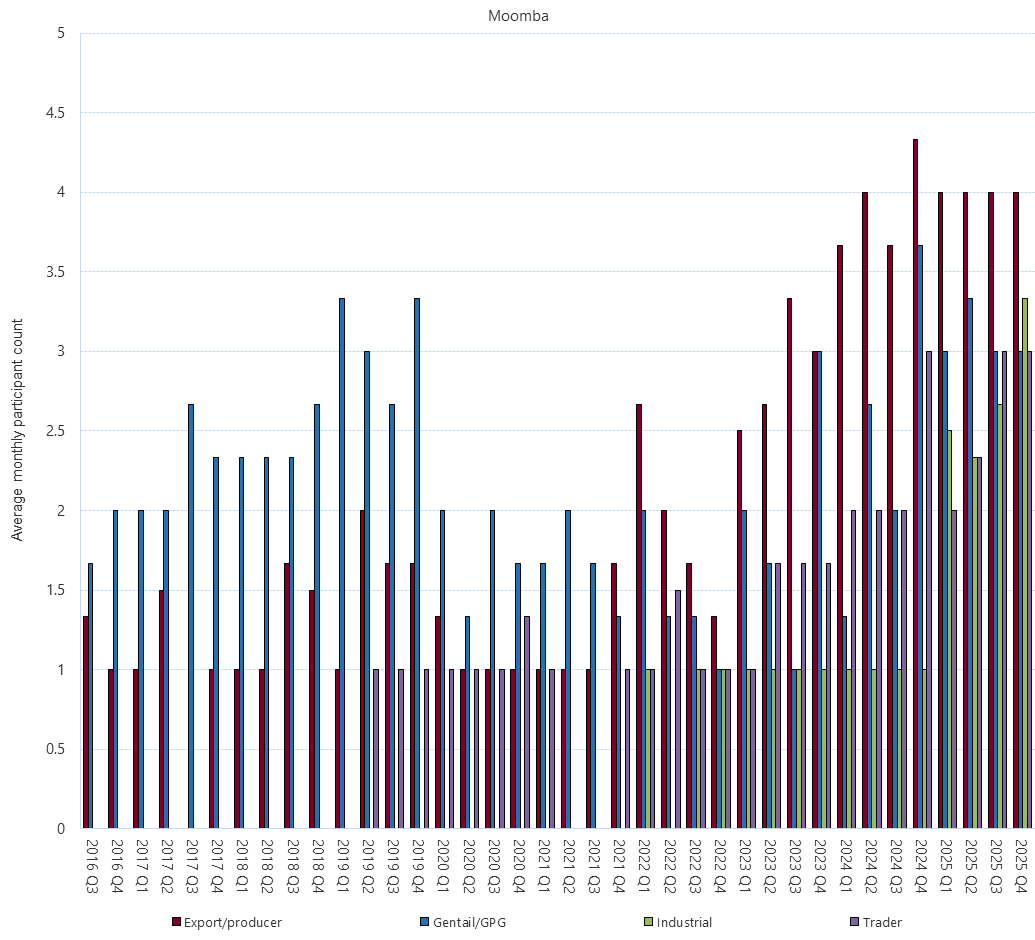
This figure is a summary of quarterly trading activity in the Moomba gas supply hub by category of trading participant type. Participant categories include traders who: export or produce gas (Export/producer); participate in the retailing of gas or generation of electricity using gas (Gentail/GPG); use gas for industrial purposes (Industrial), or; participate in the supply hub as a trader (Trader). The figure displays a quarterly average of the different number of participants falling into each of the categories, based on the participants that have placed orders on the exchange on a monthly basis.