Gas Supply Hub active participants – Wallumbilla

Tabs

Graph
Data
QuarterExport/producer (Average monthly participant count)Gentail/GPG (Average monthly participant count)Industrial (Average monthly participant count)Trader (Average monthly participant count)
2014 Q21.334.001.000.00
2014 Q32.003.671.000.00
2014 Q42.003.672.001.00
2015 Q12.004.001.331.00
2015 Q23.334.001.331.00
2015 Q34.004.672.001.00
2015 Q44.004.331.671.00
2016 Q14.004.331.001.00
2016 Q24.004.331.001.00
2016 Q34.005.001.001.00
2016 Q44.005.001.001.67
2017 Q13.335.331.002.00
2017 Q23.005.001.002.00
2017 Q33.335.001.002.00
2017 Q43.675.671.672.00
2018 Q13.336.001.001.00
2018 Q24.006.001.001.00
2018 Q34.006.001.001.00
2018 Q44.006.001.001.00
2019 Q14.006.001.002.00
2019 Q24.006.001.001.33
2019 Q34.006.001.001.00
2019 Q43.676.001.002.67
2020 Q13.677.001.002.67
2020 Q23.336.000.002.33
2020 Q35.006.000.002.67
2020 Q44.676.001.003.00
2021 Q15.006.000.003.00
2021 Q25.336.000.003.67
2021 Q35.676.000.004.00
2021 Q46.335.330.004.00
2022 Q16.335.000.003.00
2022 Q26.674.670.003.33
2022 Q36.335.001.504.00
2022 Q47.005.331.003.67
2023 Q16.675.332.004.00
2023 Q26.334.331.333.67
Download data as CSV
Information
Sector: 
Segment: 
Category: 
Gas liquidity (GSH)
AER reference: 
D11/2298801[V6]
Source: 
AER; AEMO
Overview: 

Wallumbilla in Queensland is a major gas supply hub. As a pipeline interconnection point for the Surat-Bowen Basin, it links gas markets in Queensland, South Australia, New South Wales and Victoria. It services industrial gas customers, LNG export facilities and gas powered generators, making it a natural point of trade and an ideal location for a gas trading exchange.

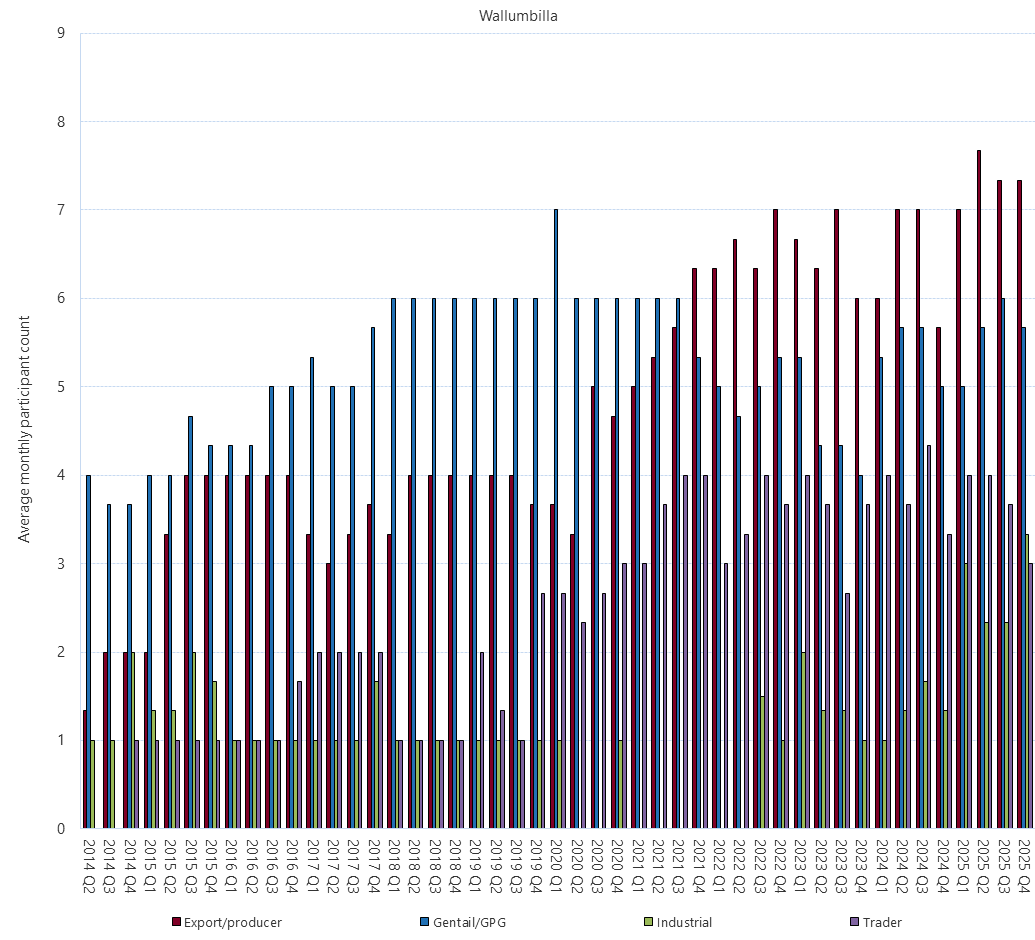
This figure is a summary of quarterly trading activity in the Wallumbilla gas supply hub by category of trading participant type. Participant categories include traders who: export or produce gas (Export/producer); participate in the retailing of gas or generation of electricity using gas (Gentail/GPG); use gas for industrial purposes (Industrial); or participate in the supply hub as a trader (Trader). The figure displays a quarterly average of the different number of participants falling into each of the categories, based on the participants that have placed orders on the exchange on a monthly basis.