Wallumbilla in Queensland is a major gas supply hub. As a pipeline interconnection point for the Surat-Bowen Basin, it links gas markets in Queensland, South Australia, New South Wales and Victoria. It services industrial gas customers, LNG export facilities and gas powered generators, making it a natural point of trade and an ideal location for a gas trading exchange.
To supplement the voluntary gas supply hub located at Wallumbilla, the Moomba hub was established from 1 June 2016 to facilitate trade on the Moomba to Adelaide Pipeline (MAP) and Moomba to Sydney Pipeline (MSP). A spread product also allows for trading between the Wallumbilla and Moomba markets on the SWQP (representing the price differential between the two hubs at the MSP and WAL trading locations).
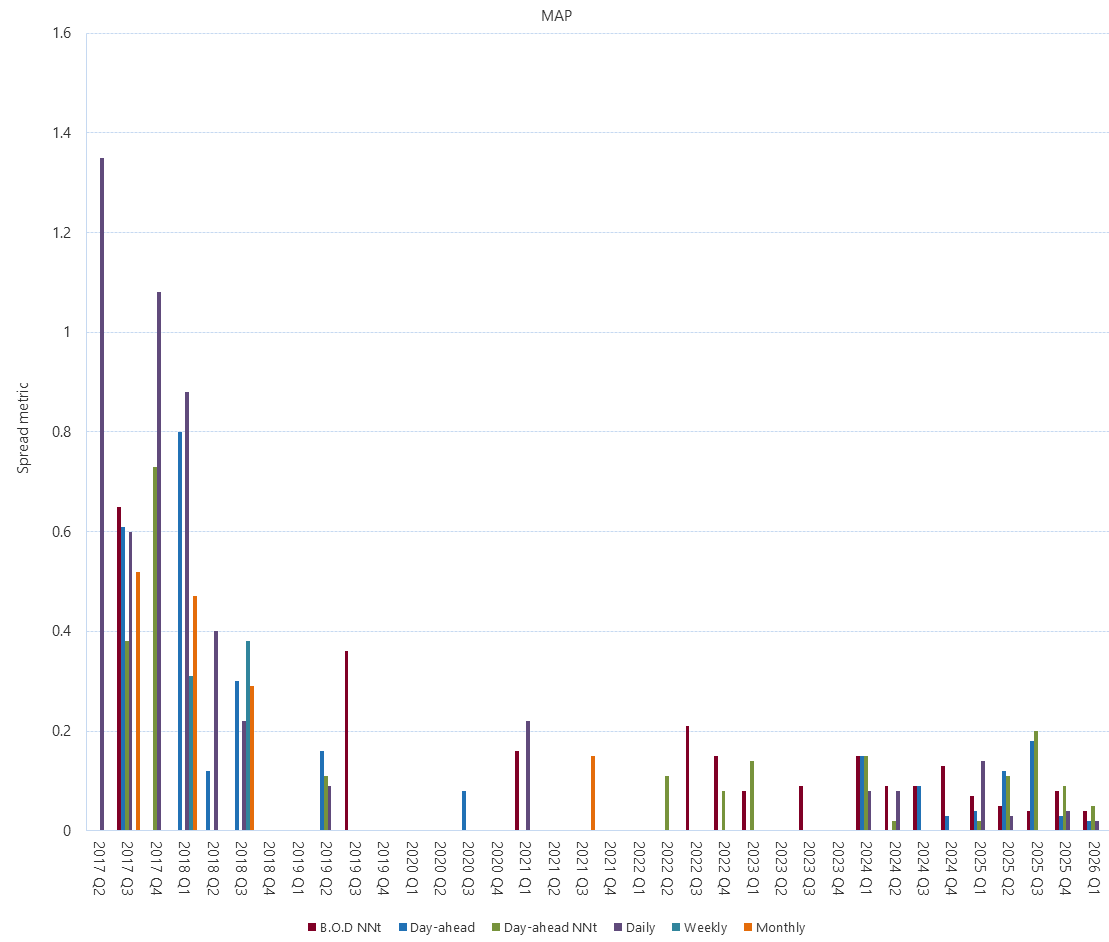
The spread indicator shows the difference between the highest bids (buy) and lowest offers (sell) price of gas commodity/service products on the gas supply hub exchange. As bid/offer prices in the Gas Supply Hub vary across the trading window each day, the measurements here are calculated as daily time-weighted averages for each product/location combination displayed in each of the figures.
This figure shows the spread metric (the difference between the sum of time-weighted offer prices and the sum of the time-weighted bid prices, divided by the sum of time-weighted bid prices) on a quarterly basis for the Moomba to Adelaide Pipeline (MAP) trading location.
TWAP(Bid) = ∑j Bj *Tj / ∑j Tj
TWAP(Offer) = ∑j Oj *Tj / ∑j Tj
Where:
Tj = time weighting of quote j.
The metric is calculated over each quarter as
Bid-Offer Liquidity Spread = ( ∑j TWAP(Offer) - ∑j TWAP(Bid) ) / ∑j TWAP(Bid)
A lower spread amount (i.e. the closer metric is to zero) indicates a higher level of liquidity.