Wallumbilla in Queensland is a major gas supply hub. As a pipeline interconnection point for the Surat-Bowen Basin, it links gas markets in Queensland, South Australia, New South Wales and Victoria. It services industrial gas customers, LNG export facilities and gas powered generators, making it a natural point of trade and an ideal location for a gas trading exchange.
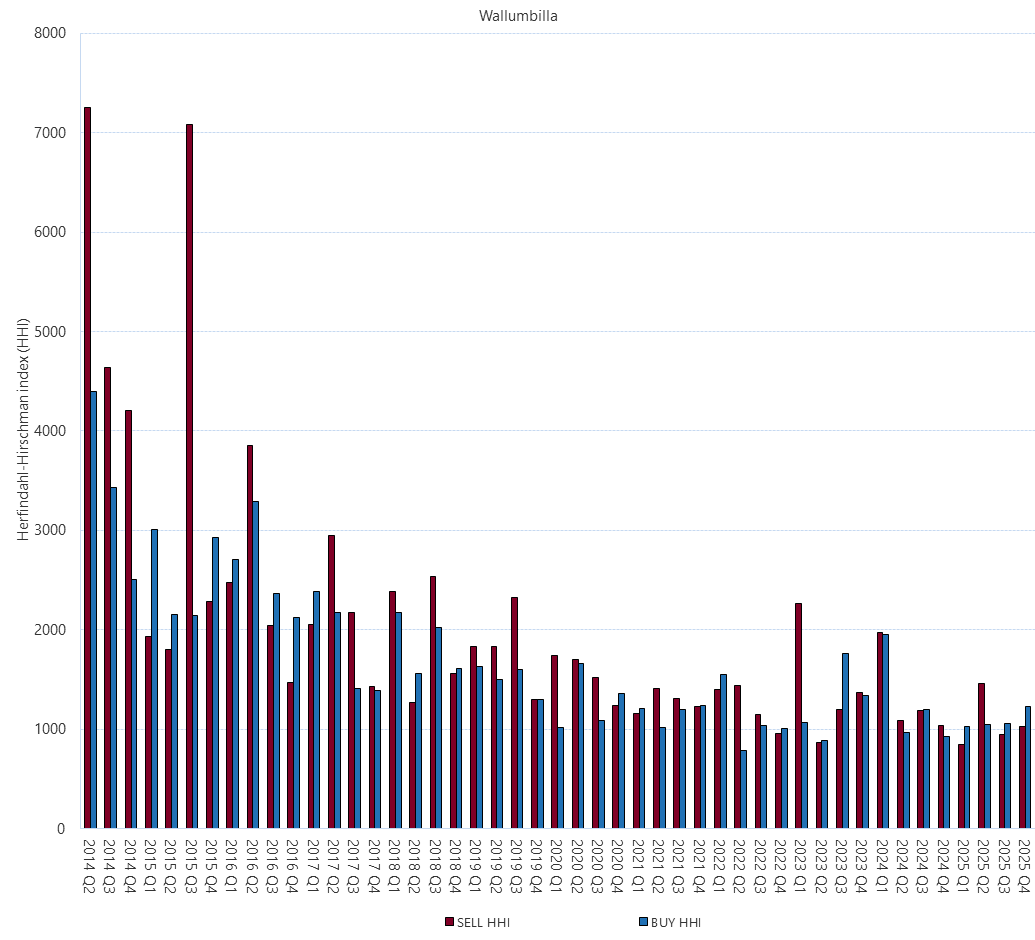
The Herfindahl-Hirschman index (HHI) is a measure of market concentration. It is calculated by squaring the market share of each participant competing in the market and then summing the resulting numbers. It can range from zero to 10,000.
A higher measure of market concentration indicates a lower level of competition. For example, one participant trading on either the buy or sell side of a trade would have a monopoly in the market and the 100 per cent market share would produce a Herfindahl-Hirschman Index (HHI) equal to 10,000. The more traders participating in the market, the closer the HHI would be to zero, indicating a higher level of competition.