Quarterly volume weighted average price by contribution of price bands - Victoria

Tabs

Graph
Data
Quarter<$0 ($ per megawatt hour)$0-$50 ($ per megawatt hour)$50-$100 ($ per megawatt hour)$100-$200 ($ per megawatt hour)$200-$300 ($ per megawatt hour)$300-$1000 ($ per megawatt hour)$1000-$5000 ($ per megawatt hour)>$5000 ($ per megawatt hour)
2006 Q10.0019.852.831.672.612.1211.3212.32
2006 Q20.0022.924.330.480.530.101.710.00
2006 Q30.0026.646.231.220.380.564.020.00
2006 Q40.0024.183.450.480.320.540.000.00
2007 Q1-0.0519.5018.826.541.183.358.8117.03
2007 Q2-0.017.7142.6218.8410.244.0015.890.00
2007 Q30.0018.5724.8813.002.501.540.000.00
2007 Q4-0.0925.9011.550.790.662.013.090.00
2008 Q1-0.0324.659.793.031.510.894.525.93
2008 Q20.0023.3121.871.980.000.000.000.00
2008 Q30.0027.3110.321.300.070.380.502.46
2008 Q4-0.0224.139.000.530.000.000.000.00
2009 Q1-0.9722.138.183.033.580.4310.9839.47
2009 Q20.0026.107.430.590.160.000.000.00
2009 Q30.0023.311.380.270.000.000.000.00
2009 Q4-0.1324.002.330.870.620.131.410.00
2010 Q10.0023.921.870.500.441.029.8928.84
2010 Q20.0024.713.551.000.270.002.8515.47
2010 Q3-0.1424.861.180.080.000.000.000.00
2010 Q4-0.3418.670.120.040.000.000.650.00
2011 Q1-0.0625.861.390.781.240.374.157.34
2011 Q20.0028.331.320.150.000.000.430.00
2011 Q3-0.0127.751.870.220.000.000.000.00
2011 Q4-0.1024.810.110.000.000.000.000.00
2012 Q1-0.0225.200.220.120.000.000.000.00
2012 Q2-0.0429.712.730.130.000.000.000.00
2012 Q30.0011.2144.632.680.730.093.230.00
2012 Q40.0020.6529.621.751.281.111.6710.46
2013 Q10.0029.7819.740.950.370.915.210.00
2013 Q2-0.0117.8034.282.940.050.001.520.00
2013 Q30.0015.7037.641.570.000.000.000.00
2013 Q4-0.0431.3816.310.000.080.631.920.00
2014 Q1-0.0527.1819.122.262.331.888.592.45
2014 Q20.0030.0016.870.860.070.000.000.00
2014 Q30.0029.577.440.600.000.000.000.00
2014 Q4-0.0427.600.430.050.000.000.000.00
2015 Q1-0.1926.401.370.260.050.000.000.00
2015 Q2-0.0229.441.950.790.130.130.000.00
2015 Q30.0030.576.601.400.050.000.590.00
2015 Q4-0.0425.8710.942.622.280.460.610.00
2016 Q1-0.0525.7110.532.411.080.133.046.77
2016 Q2-0.6712.6626.3717.9512.870.270.000.00
2016 Q3-0.1418.2420.208.804.790.640.000.00
2016 Q4-0.3719.3713.881.730.210.000.000.00
2017 Q1-0.139.2131.6834.878.070.730.890.00
2017 Q20.000.6035.6667.632.750.190.000.00
2017 Q30.001.8637.6857.685.760.350.000.00
2017 Q4-0.051.9557.0424.363.750.340.580.00
2018 Q1-0.051.2756.8425.131.200.5413.4021.40
2018 Q2-0.032.4453.7023.884.920.450.560.00
2018 Q3-0.443.9839.6933.397.610.090.000.00
2018 Q4-0.071.4341.0849.295.850.641.740.00
2019 Q1-0.031.2826.4565.0623.424.547.2485.00
2019 Q20.002.2134.6156.696.810.190.000.00
2019 Q3-0.213.4338.4540.5413.895.561.110.00
2019 Q4-0.297.5642.2720.327.350.261.962.56
2020 Q1-0.5419.8225.753.711.620.513.8054.49
2020 Q2-0.3123.4014.343.311.040.521.110.00
2020 Q3-0.3417.8927.266.482.200.310.570.00
2020 Q4-2.1620.9315.113.512.480.160.000.00
2021 Q1-1.6323.434.120.750.210.000.000.00
2021 Q2-1.2011.9324.2618.9311.192.174.335.82
2021 Q3-3.637.7923.9116.9014.154.180.820.00
2021 Q4-4.968.8722.415.081.210.000.000.00
2022 Q1-2.835.9234.7118.111.760.520.005.60
2022 Q2-1.041.453.2237.1291.13100.084.154.86
2022 Q3-3.262.075.5144.1436.61121.733.210.00
2022 Q4-9.243.9111.1847.3816.760.490.000.00
2023 Q1-8.463.4023.1639.213.661.361.400.00
2023 Q2-3.453.8116.5746.2326.106.390.000.00
Download data as CSV
Information
Sector: 
Segment: 
Category: 
Electricity spot prices
AER reference: 
11048184
Source: 
AER; AEMO
Overview: 

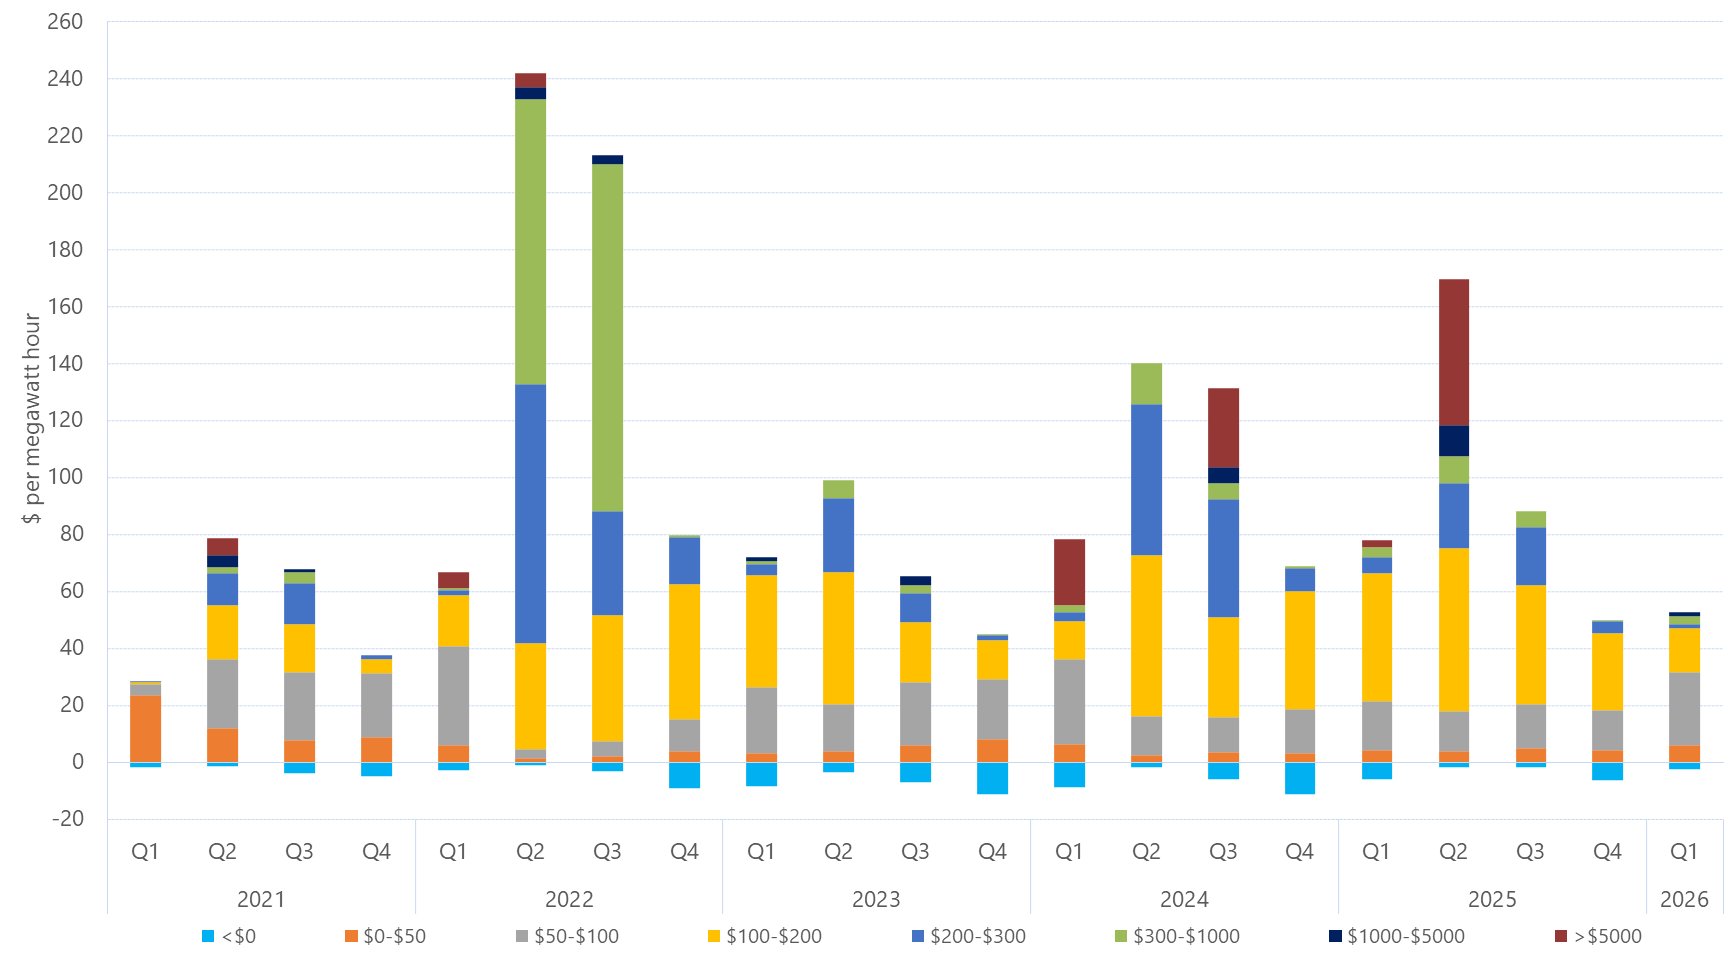
This figure shows the contribution of spot price in various price bands to the quarterly volume weighted average price in Victoria for the past five years. The data tab contains data since 2006.