Seasonal peak demand - regions

Tabs

Graph
Data
PeriodQueensland
(Megawatts)
Queensland
(Date occurred)
New South Wales
(Megawatts)
New South Wales
(Date occurred)
Victoria
(Megawatts)
Victoria
(Date occurred)
South Australia
(Megawatts)
South Australia
(Date occurred)
Tasmania
(Megawatts)
Tasmania
(Date occurred)
Summer 1998/99599418/02/19991027515/02/1999667004/02/1999242704/02/1999
Winter 1999587928/06/19991142415/06/1999674515/06/1999192115/06/1999
Summer 1999/00634021/01/20001066209/02/2000771702/03/2000264602/02/2000
Winter 2000634306/06/20001182230/05/2000711329/05/2000214228/06/2000
Summer 2000/01658429/01/20011154724/01/2001801908/02/2001283307/02/2001
Winter 2001639709/07/20011171309/07/2001713714/06/2001209524/07/2001
Summer 2001/02704511/02/20021098221/01/2002758114/02/2002250019/02/2002
Winter 2002634502/07/20021207418/06/2002730027/06/2002212927/06/2002
Summer 2002/03710531/01/20031233130/01/2003804124/02/2003278704/02/2003
Winter 2003677831/07/20031246828/07/2003749930/07/2003213723/06/2003
Summer 2003/04791823/02/20041221609/03/2004858317/12/2003260216/12/2003
Winter 2004710621/06/20041304119/07/2004743728/07/2004215619/07/2004
Summer 2004/05818908/02/20051285430/11/2004849225/01/2005262511/01/2005
Winter 2005724927/06/20051312323/06/2005775012/07/2005226312/07/2005171827/06/2005
Summer 2005/06827114/02/20061329702/02/2006874224/02/2006292120/01/2006134820/03/2006
Winter 2006761420/06/20061307820/07/2006788005/06/2006237914/06/2006174730/05/2006
Summer 2006/07862512/03/20071286830/01/2007908016/01/2007295816/01/2007155616/11/2006
Winter 2007783820/06/20071389417/07/2007836917/07/2007246019/06/2007182718/06/2007
Summer 2007/08811522/02/20081294430/01/2008983017/03/2008315517/03/2008151331/03/2008
Winter 2008820328/07/20081429228/07/2008808928/07/2008253429/07/2008188421/07/2008
Summer 2008/09869709/02/20091409706/02/20091049029/01/2009339129/01/2009151105/11/2008
Winter 2009770716/07/20091300310/06/2009818810/06/2009244123/06/2009176309/07/2009
Summer 2009/10893318/01/20101391322/01/20101008811/01/2010330211/01/2010146030/11/2009
Winter 2010742129/06/20101332429/06/2010812728/06/2010250801/07/2010178309/07/2010
Summer 2010/11880921/02/20111476401/02/2011990601/02/2011339731/01/2011147531/03/2011
Winter 2011772509/06/20111294219/07/2011824207/06/2011238508/06/2011183005/07/2011
Summer 2011/12869909/01/20121207230/01/2012915524/01/2012297823/01/2012144803/11/2011
Winter 2012746127/06/20121220505/06/2012795021/06/2012241924/05/2012170527/06/2012
Summer 2012/13860604/12/20121390618/01/2013976012/03/2013309617/01/2013141502/11/2012
Winter 2013723322/05/20131166224/06/2013789824/06/2013235222/07/2013176624/06/2013
Summer 2013/14846522/01/20141201620/12/20131030816/01/2014328016/01/2014146908/11/2013
Winter 2014740701/07/20141141230/06/2014764815/07/2014239531/07/2014172830/06/2014
Summer 2014/15896905/03/20151187421/11/2014863522/01/2015280607/01/2015145727/03/2015
Winter 2015800617/07/20151212916/07/2015792314/07/2015245021/07/2015174719/06/2015
Summer 2015/16926001/02/20161359925/02/2016952313/01/2016295717/12/2015146103/11/2015
Winter 2016811727/06/20161262027/06/2016776726/07/2016246026/07/2016167623/07/2016
Summer 2016/17950818/01/20171410710/02/2017873009/02/2017308508/02/2017147908/11/2016
Winter 2017780513/06/20171198603/07/2017747220/07/2017230703/07/2017174327/06/2017
Summer 2017/18992214/02/20181308119/12/2017915919/01/2018296218/01/2018141208/11/2017
Winter 2018827718/06/20181212319/06/2018748428/06/2018238026/06/2018173628/06/2018
Summer 2018/191017913/02/20191386131/01/2019931824/01/2019324424/01/2019139509/11/2018
Winter 2019818904/06/20191214004/06/2019760129/05/2019256524/06/2019175624/06/2019
Summer 2019/20997103/02/20201382701/02/2020961831/01/2020322119/12/2019144408/11/2019
Winter 2020825014/07/20201216523/06/2020763001/06/2020251209/06/2020169909/06/2020
Summer 2020/21958122/02/20211253528/11/2020839111/01/2021283418/02/2021138306/11/2020
Winter 2021826721/07/20211298910/06/2021793320/07/2021262722/07/2021178425/07/2021
Summer 2021/221010208/03/20221251801/02/2022859727/01/2022259311/01/2022153615/11/2021
Winter 2022877704/07/20221239019/07/2022813531/05/2022245319/07/2022180914/06/2022
Summer 2022/23 YTD899006/12/2022958705/12/2022826227/12/2022282227/12/2022152115/11/2022
Download data as CSV
Information
Sector: 
Segment: 
Category: 
Electricity demand and energy
AER reference: 
11048184
Source: 
AER; AEMO
Overview: 

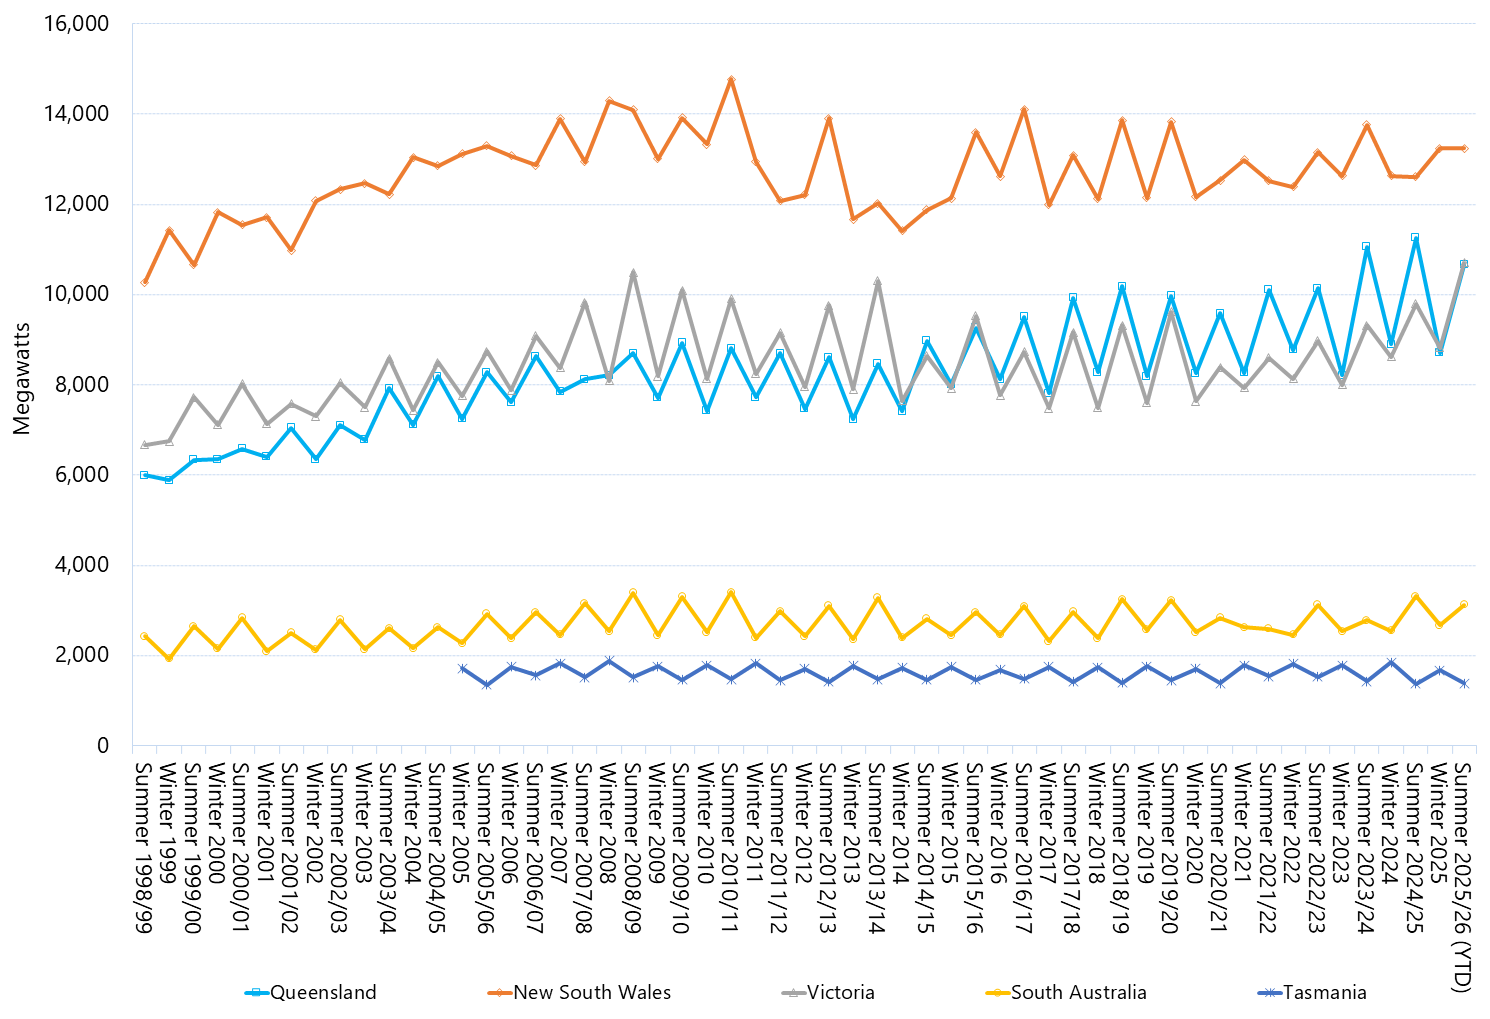
This figure presents summer and winter peak demand by region since the commencement of the NEM. In addition, the data table also presents the date that peak demand occurred. Summer demand refers to the period 1 November to 31 March and winter demand refers to the period 1 May to 31 July each year.