Results
251 result(s), displaying 157 to 168
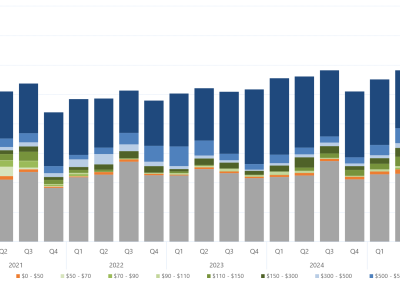
Quarterly average regional offers by price bands - South Australia
This figures shows the quarterly average amount of capacity offered within each price band by all generators in South Australia for the past five years.
Content type
Chart
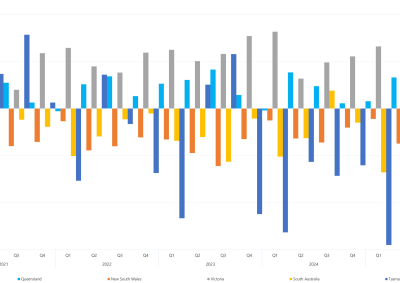
Quarterly interregional trade as a percentage of regional energy consumption
This figure presents the quarterly net trading positions of the regions in the National Energy Market for the past five years.
Content type
Chart