Results
251 result(s), displaying 217 to 228
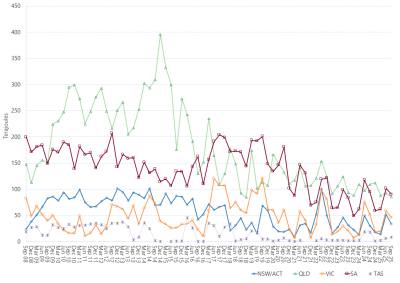
Average daily gas used for gas powered generation
This figure shows average daily demand for gas by Gas Powered Generators in the National Electricity Market, grouped by region, by quarter.
Content type
Chart
Archived reports to DMS contacts
Content type
Page
AER reports on Q1 2024 high electricity price events
The AER has reported on high electricity prices in the National Energy Market over January, February and March 2024.
Type
Communications
Prices above $5,000/MWh - October to December 2023
The AER has reported on high energy prices in the National Electricity Market during the October to December 2023 quarter.
Type
Performance reports
Prices above $5,000/MWh - January to March 2025
A combination of factors contributed to high electricity prices in the National Energy Market this quarter.
Type
Performance reports
AER reports on Q2 2024 high electricity price events
The AER has reported on high electricity prices in the National Energy Market over April, May, and June 2024.
Type
Communications
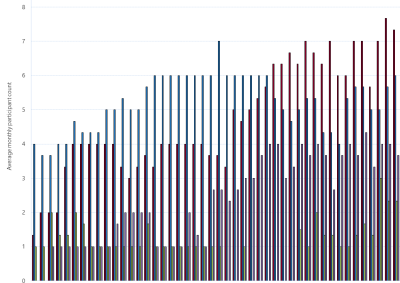
Gas Supply Hub active participants – Wallumbilla
This figure is a summary of quarterly trading activity in the Wallumbilla gas supply hub by category of trading participant type.
Content type
Chart