Results
251 result(s), displaying 229 to 240
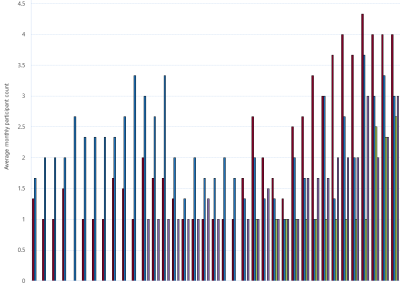
Gas Supply Hub active participants – Moomba
This figure is a summary of quarterly trading activity in the Moomba gas supply hub by category of trading participant type.
Content type
Chart
2023 Gas Short Term Transaction Report released
This special AER report provides analysis and insights on bilateral short term gas supply and swap transactions on contracts with lengths up to a year.
Type
Communications
AER reports on Q3 2024 high electricity price events
The AER has reported on high electricity prices in the National Energy Market during July, August, and September 2024.
Type
Communications
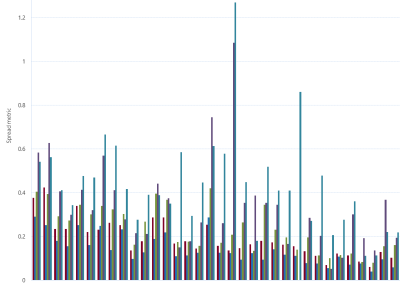
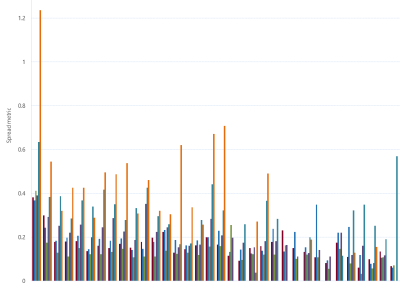
Gas Supply Hub bid-offer spread metric (MAP)
The spread indicator shows the difference between the highest bids (buy) and lowest offers (sell) price of gas commodity/service products on the GSH (MAP).
Content type
Chart
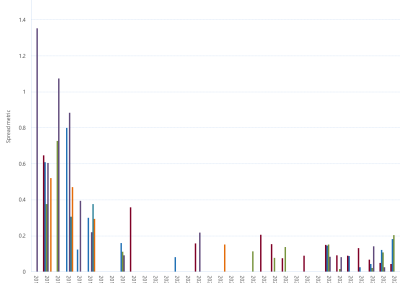
Gas Supply Hub bid-offer spread metric (MSP)
The spread indicator shows the difference between the highest bids (buy) and lowest offers (sell) price of gas commodity/service products on the GSH (MSP).
Content type
Chart
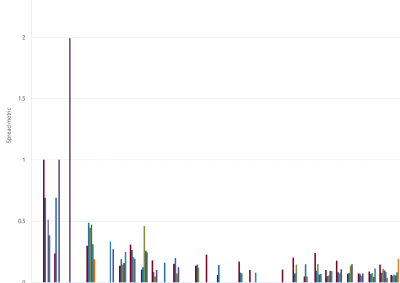
Gas Supply Hub bid-offer spread metric (SEQ)
The spread indicator shows the difference between the highest bids (buy) and lowest offers (sell) price of gas commodity/service products on the GSH (SEQ).
Content type
Chart
Gas Supply Hub bid-offer spread metric (WAL)
The spread indicator shows the difference between the highest bids (buy) and lowest offers (sell) price of gas commodity/service products on the GSH (WAL).
Content type
Chart