Gas Supply Hub delivered quantities

Tabs

Graph
Data
Month beginningWAL - Exchange (Volume (TJ))WAL Compression - Exchange (Volume (TJ))SEQ - Exchange (Volume (TJ))MOO - Exchange (Volume (TJ))WAL - Off market (Volume (TJ))WAL Compression - Off market (Volume (TJ))SEQ - Off market (Volume (TJ))MOO - Off market (Volume (TJ))
01/04/20141920006000
01/05/20141180000000
01/06/20142760000000
01/07/20144520000000
01/08/20141730000000
01/09/20143480000000
01/10/20142330000000
01/11/20141120000000
01/12/20144350000000
01/01/20154260000000
01/02/2015770000000
01/03/201513200013000
01/04/201512900035000
01/05/201511300015000
01/06/2015395000154000
01/07/2015529000217000
01/08/2015528000230000
01/09/2015580000585000
01/10/2015337000298000
01/11/2015310000289000
01/12/2015617000339000
01/01/2016326000167000
01/02/2016189000213000
01/03/2016269000444000
01/04/2016150000137000
01/05/201650000144000
01/06/2016191000431000
01/07/2016373000904000
01/08/2016607000697000
01/09/20163050001100000
01/10/201666000224000
01/11/2016176000109000
01/12/2016342000263000
01/01/2017236000302000
01/02/2017106000211000
01/03/20172510200218000
01/04/2017172012201850800
01/05/201775011608602130
01/06/20176960186045501960
01/07/20173260561071701170
01/08/201789030909302550
01/09/20171850529216503330
01/10/2017340065402902780
01/11/20172330754020044710
01/12/20172210505028802160
01/01/2018185035206501650
01/02/2018150027409402860
01/03/2018204034304403960
01/04/20182710373021404040
01/05/20181480424039205711
01/06/20185903360215052714
01/07/20185803410407048928
01/08/2018870341021705460
01/09/20182220442026203880
01/10/20184702130469092733
01/11/201832073062508910
01/12/20183201820925014260
01/01/201916302833074406240
01/02/20193230288039904940
01/03/20191690362085508850
01/04/20191950305090604374
01/05/20193520310501023061185
01/06/2019571038214910920502381
01/07/201957302751815240292191
01/08/20191089050820314400298155
01/09/2019681042101849024640
01/10/201934703510557028438
01/11/201913501240738020563
01/12/201930903100604026767
01/01/2020408059015785042910
01/02/2020219027616129806293
01/03/202029603720990083445
01/04/202081032093203700
01/05/202092044079703635
01/06/2020450689738016314
01/07/202034503721410670725169
01/08/20203120221124778019840
01/09/20202880120184440680
01/10/20201000455100901274
01/11/20205903901087027038
01/12/20204503001862024510
01/01/202122045291001880
01/02/202154048270601280
01/03/202185061085504100
01/04/202124037087601990
01/05/20213850355075502330
01/06/202134602710188107830
01/07/202148901665195304700
01/08/202134401760180805910
01/09/202181030010820790
01/10/202123707001250020248
01/11/20218501551371044390
01/12/2021164072018110448102
01/01/20222250161058602080
01/02/202224701521606050810
01/03/20224890149097104265
01/04/2022137052184402064
01/05/20221020220114601880
01/06/2022391044415190903160
01/07/20222330515316703750
01/08/20222830580431901230366
01/09/20222150500351108118
01/10/20222280113024230273482
01/11/202230407203640021996
01/12/20224820168132412014593
01/01/202351401850205904679
01/02/2023105108331496021933
01/03/2023517089126080781159
01/04/202317901041122350167308
01/05/2023178038817690160450
01/06/20231180334318670320494
Download data as CSV
Information
Sector: 
Segment: 
Category: 
Gas liquidity (GSH)
AER reference: 
D11/2298801[V6]
Source: 
AER; AEMO
Overview: 

Wallumbilla in Queensland is a major gas supply hub. As a pipeline interconnection point for the Surat-Bowen Basin, it links gas markets in Queensland, South Australia, New South Wales and Victoria. It services industrial gas customers, LNG export facilities and gas powered generators, making it a natural point of trade and an ideal location for a gas trading exchange.

To supplement the voluntary gas supply hub located at Wallumbilla, the Moomba hub was established from 1 June 2016 to facilitate trade on the Moomba to Adelaide Pipeline (MAP) and Moomba to Sydney Pipeline (MSP). A spread product also allows for trading between the Wallumbilla and Moomba markets on the SWQP (representing the price differential between the two hubs at the MSP and WAL trading locations).

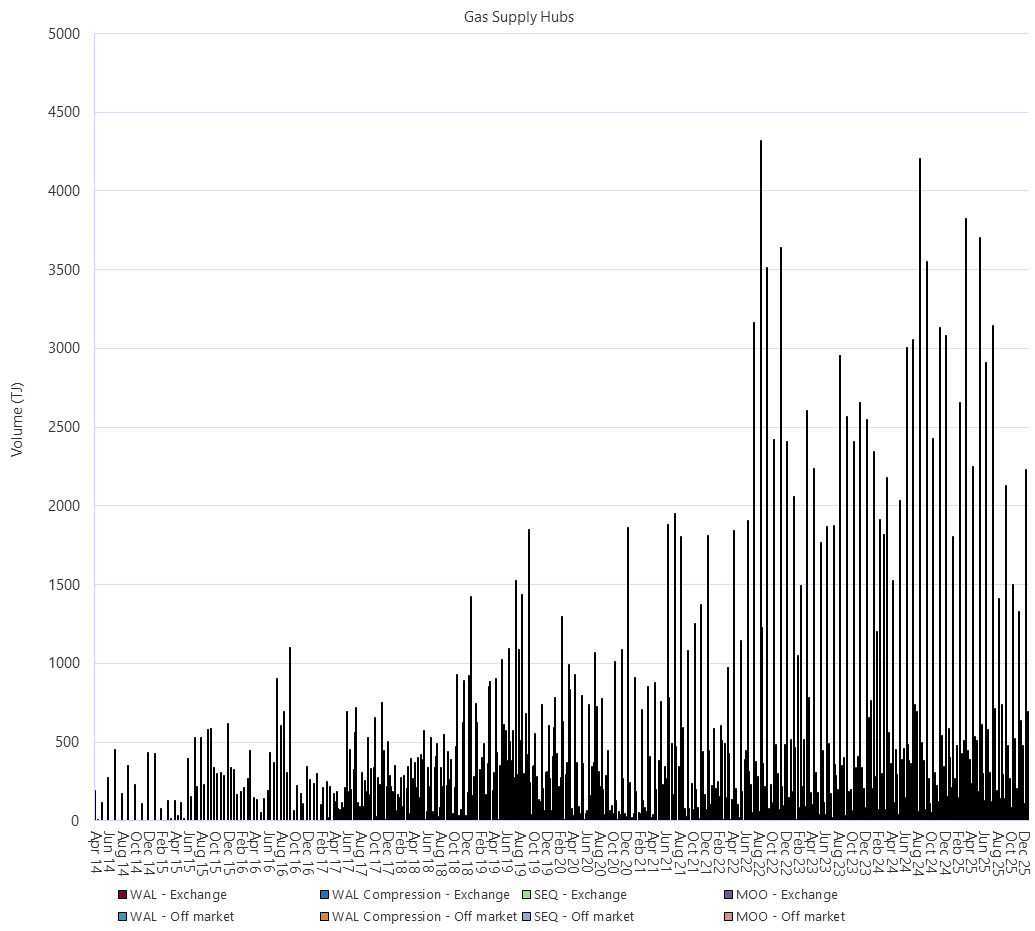
From 28 March 2017, the Wallumbilla hub was transitioned to a single product design. The WAL information in the figure is grouping the former South West Queensland Pipeline (SWQP), Roma to Brisbane Pipeline (RBP) and Queensland Gas Pipeline (QGP) trading locations under WAL. A separate in-pipe trading point at Wallumbilla was also introduced at SEQ in the transition. The trading activity at MAP and MSP has been grouped as MOO in the figure.

The information shown in this figure is the gas traded in the Wallumbilla and Moomba Gas Supply Hubs, displayed by the date of delivery of the traded commodity (as opposed to the date the trades occurred).

Note: Corrections have been made to include a small number of MOO Not-netted trades previously missing from the AER dataset.