Annual count of 30-minute prices above $5,000/MWh

Tabs

Graph
Data
Financial yearQueensland (Number of trading intervals)New South Wales (Number of trading intervals)Victoria (Number of trading intervals)South Australia (Number of trading intervals)Tasmania (Number of trading intervals)Snowy (Number of trading intervals)
2001-0235000
2002-0375202
2003-0487016
2004-05110046
2005-069205156
2006-07151962013
2007-0818125203
2008-0929132816
2009-1092117471
2010-11814396
2011-1201000
2012-1310300
2013-1401130
2014-15160000
2015-1603210
2016-171470150
2017-1800690
2018-190016160
2019-200111270
2020-218133100
2021-223673179
2022-231780204
Download data as CSV
Information
Sector: 
Segment: 
Category: 
Electricity spot prices
AER reference: 
11048184
Source: 
AER; AEMO
Overview: 

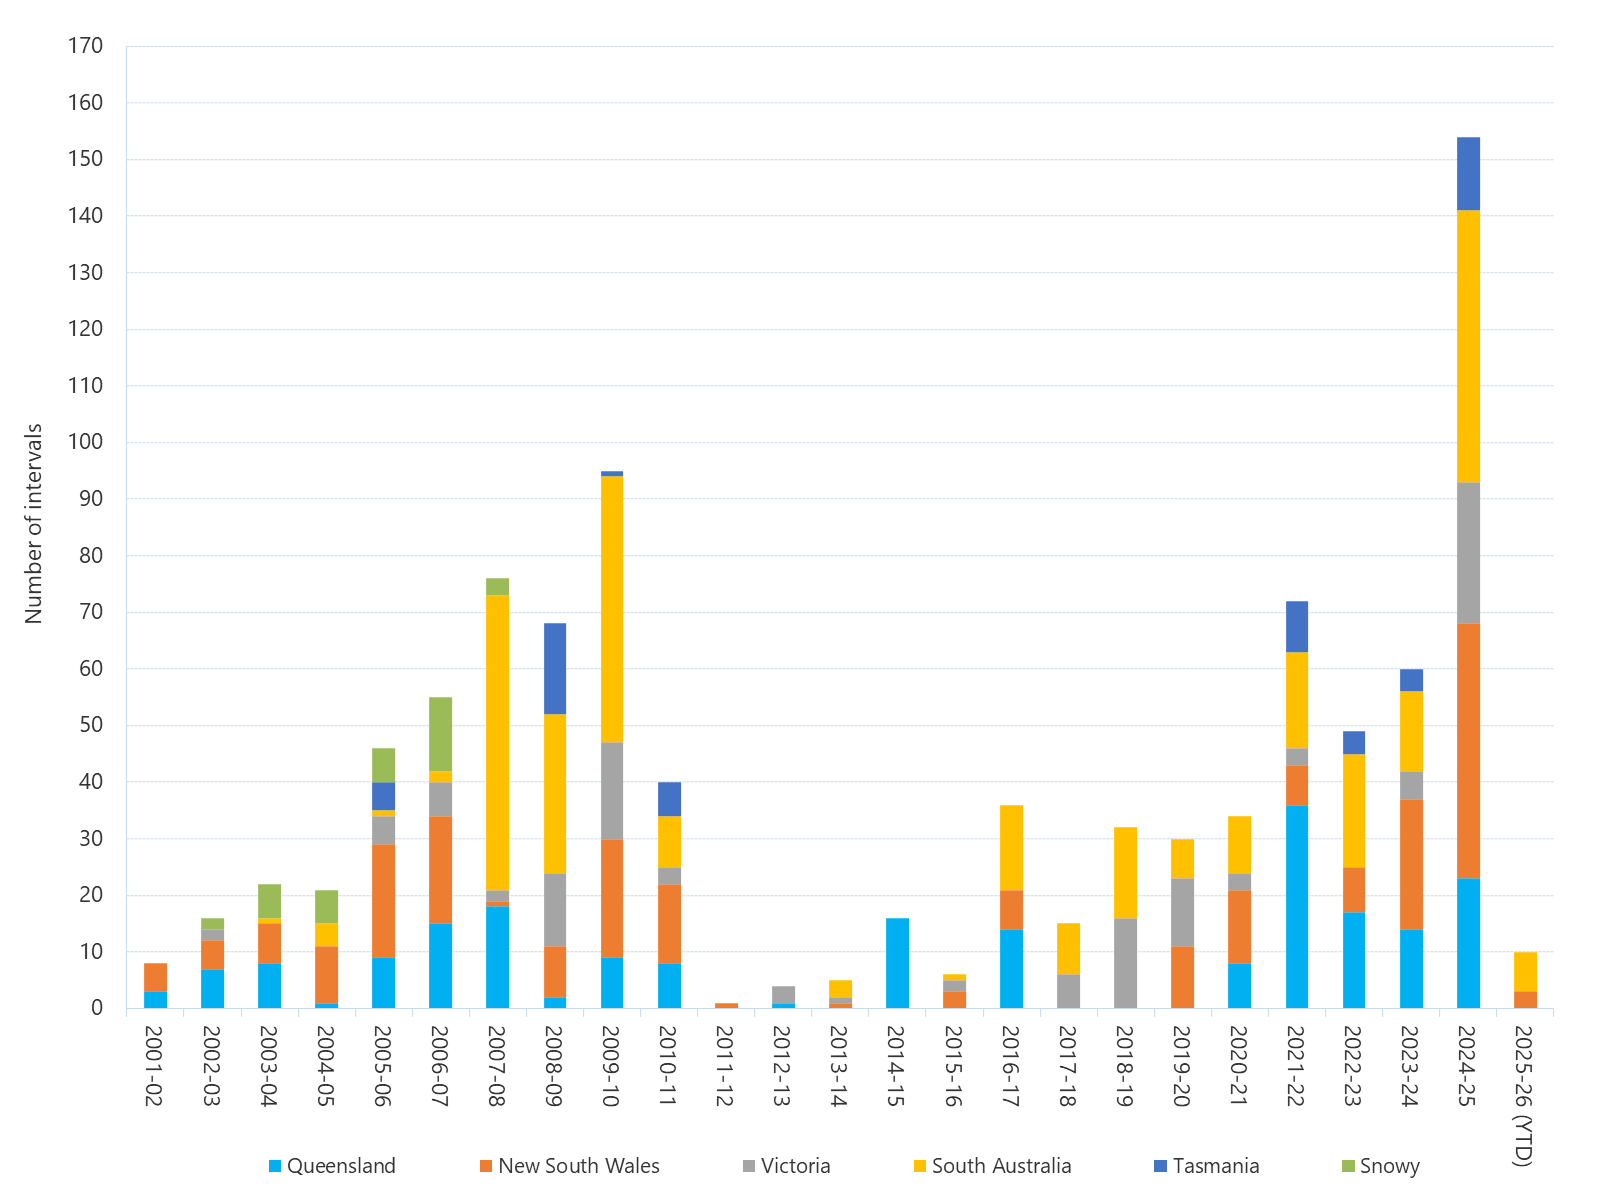
This figure shows the annual number of 30-minute intervals where the spot price for electricity has exceeded $5,000/MWh. Under the Electricity Rules, the AER is required to publish reports into significant price outcomes in the NEM. The AER publishes these reports when the 30-minute price exceeds $5,000/MWh.