Annual count of 30-minute prices below $0/MWh

Tabs

Graph
Data
Financial yearQueensland (Number of trading intervals)New South Wales (Number of trading intervals)Victoria (Number of trading intervals)South Australia (Number of trading intervals)Tasmania (Number of trading intervals)
2001-020010
2002-031024
2003-041011
2004-051030
2005-0660100
2006-07206963
2007-081402476
2008-0942237581
2009-10138886150
2010-113341417754
2011-1217014120123
2012-133211407
2013-1420618109
2014-151512815493
2015-16117228840
2016-1720118298416
2017-18150813986
2018-1924066275370
2019-20391273171187416
2020-217424412812284580
2021-22848427274534311606
2022-23122568934974169536
Download data as CSV
Information
Sector: 
Segment: 
Category: 
Electricity spot prices
AER reference: 
11048184
Source: 
AER; AEMO
Overview: 

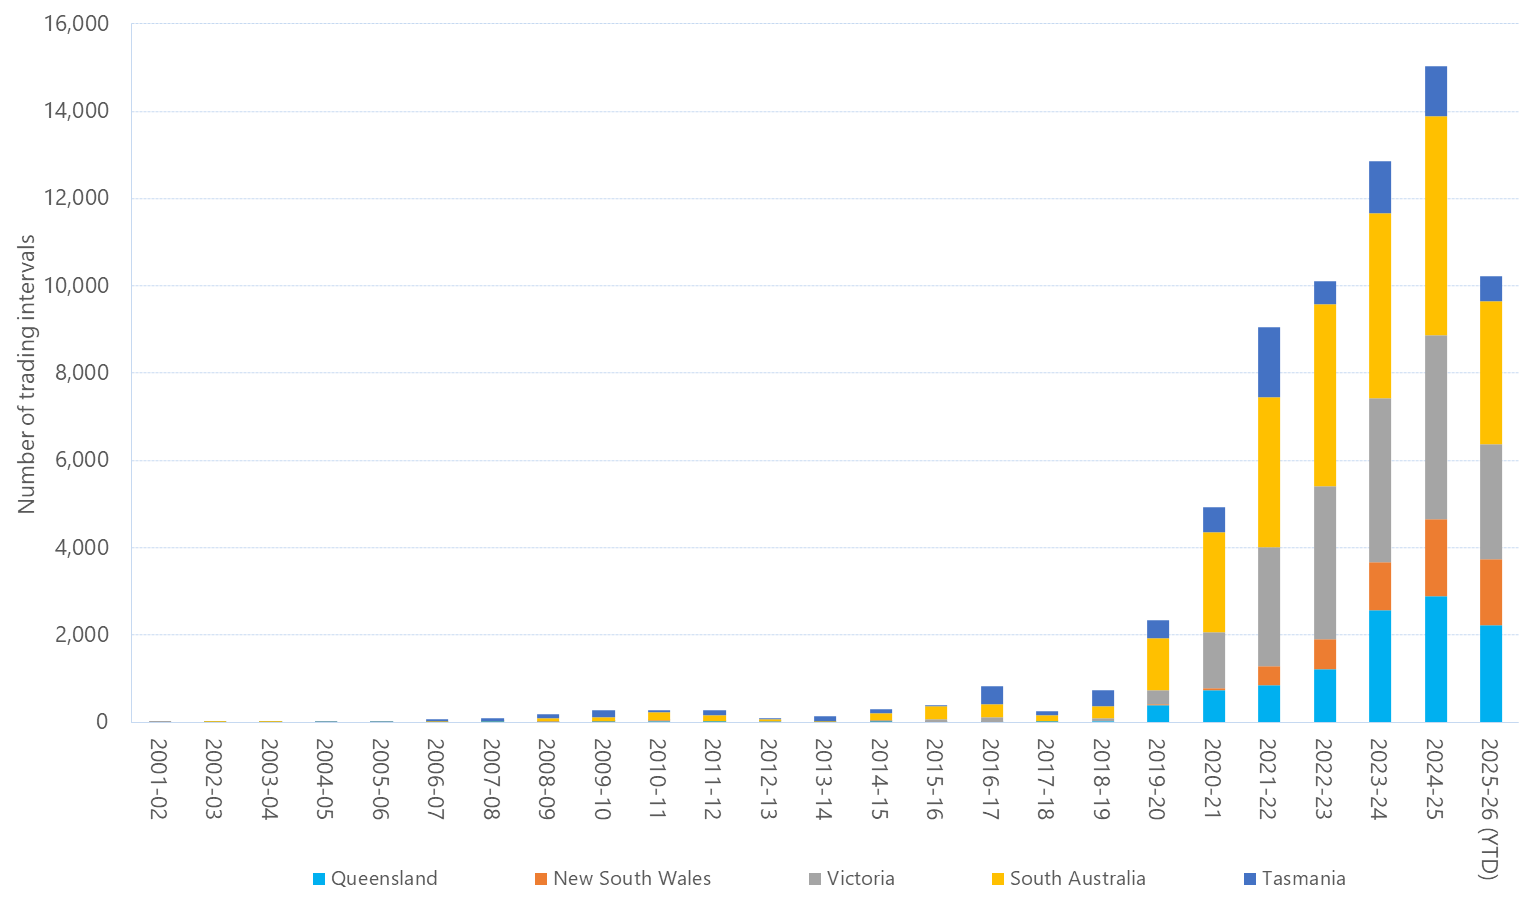
This figure shows the annual number of trading intervals where the 30-minute price for electricity was below $0/MWh