Tabs Graph Download graph Data Financial yearQueensland (Terawatt hours)New South Wales (Terawatt hours)Victoria (Terawatt hours)South Australia (Terawatt hours)Tasmania (Terawatt hours)Snowy (Terawatt hours)NEM (Terawatt hours) 1999-0041.067.645.812.40.2167.1 2000-0143.069.446.913.00.3172.5 2001-0245.270.246.812.50.3175.0 2002-0346.371.648.213.00.2179.3 2003-0448.373.749.212.90.3184.4 2004-0549.474.449.712.71.40.4188.0 2005-0651.276.850.612.89.90.5201.7 2006-0751.778.651.814.310.71.3208.3 2007-0851.778.952.714.311.11.6210.2 2008-0952.979.652.414.511.0210.5 2009-1053.578.552.414.411.0209.8 2010-1151.778.152.114.511.1207.5 2011-1251.675.351.614.010.7203.4 2012-1351.371.650.713.910.8198.2 2013-1450.469.749.313.410.8193.6 2014-1553.170.346.913.010.6194.0 2015-1655.471.247.113.410.5197.6 2016-1756.471.645.312.710.6196.5 2017-1855.871.345.612.611.0196.2 2018-1956.171.744.712.510.8195.7 2019-2055.469.844.312.210.6192.4 2020-2154.568.143.411.910.7188.6 2021-2255.067.543.711.711.1189.1 2022-2354.168.043.711.711.0188.4 Download data as CSV Information Sector: ElectricitySegment: WholesaleCategory: Electricity demand and energyAER reference: 11048184Source: AER; AEMOOverview: 
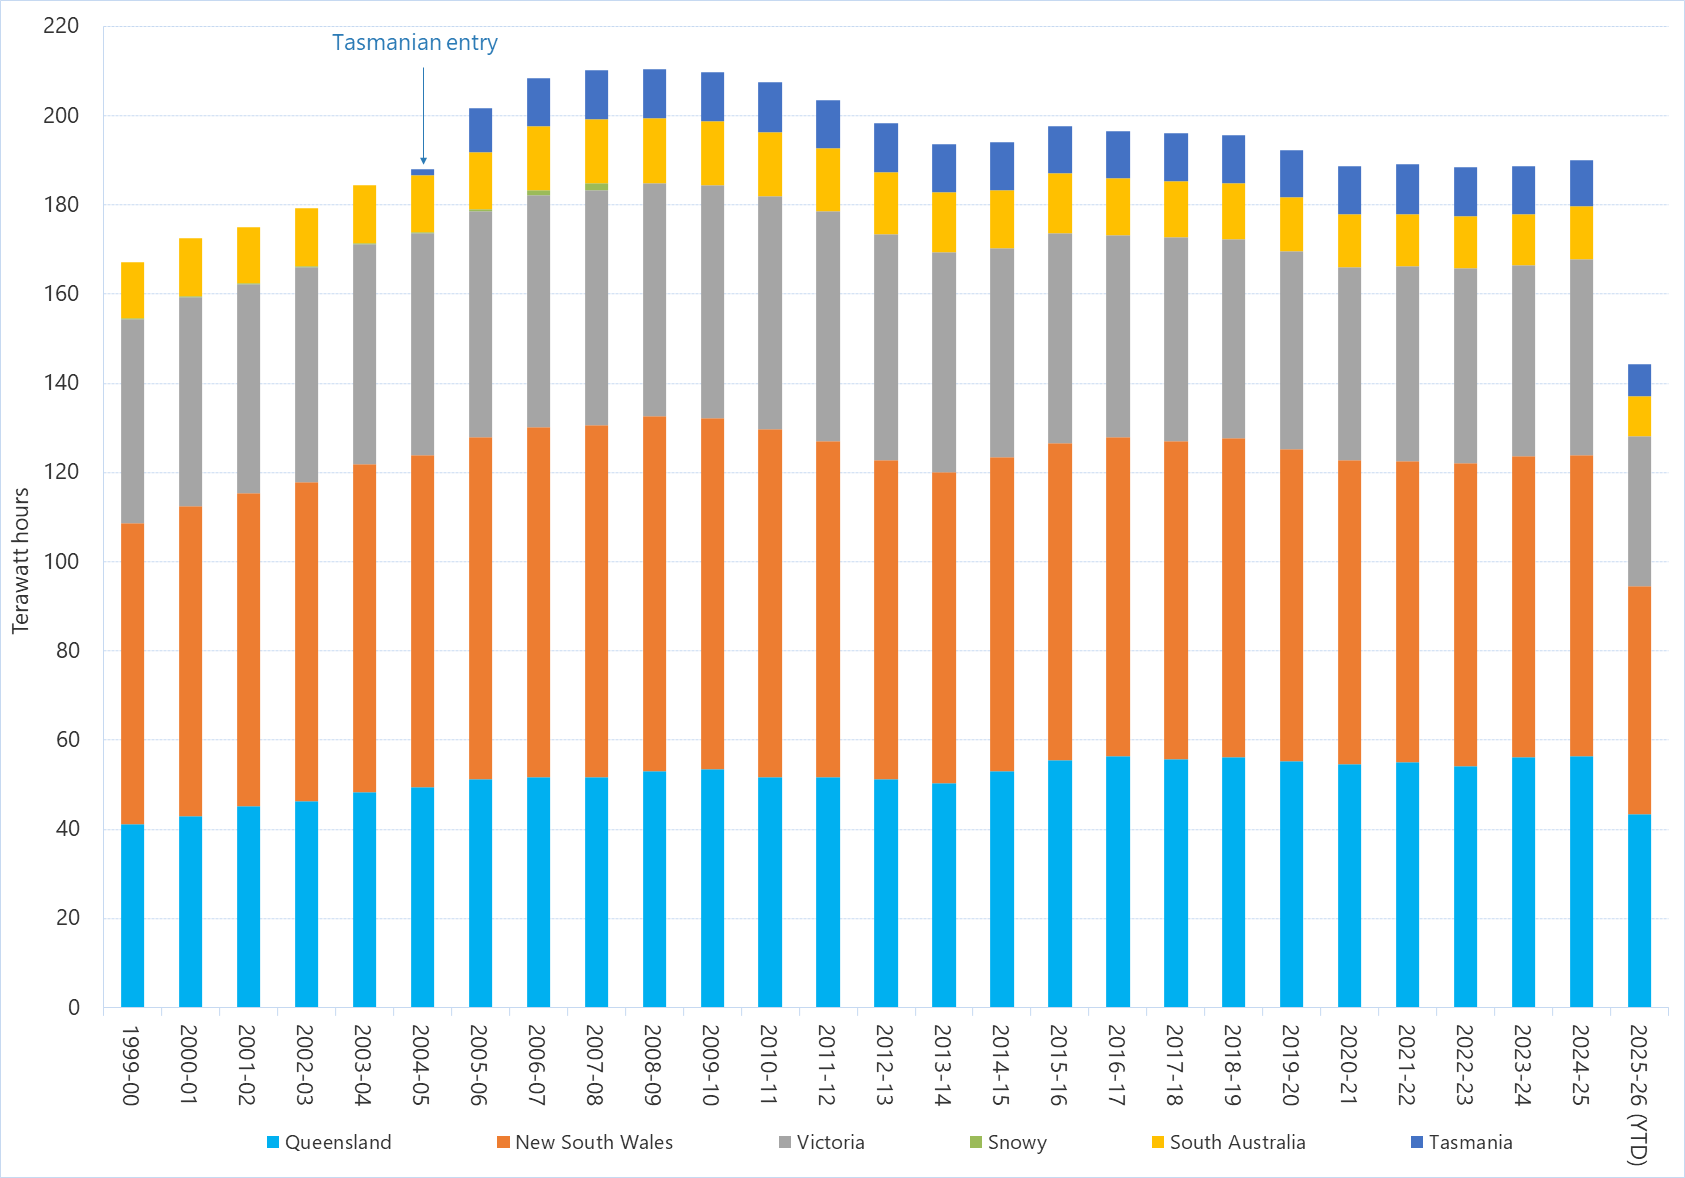
This figure presents total annual energy consumption in the NEM based on generated energy per financial year and measured in Terawatt hours. Tasmania joined the NEM in the 2004-05 financial year. Download:Download graphDownload data as CSV