Tabs Graph Download graph Data Financial YearQueensland (Percent Imports (-) or Exports (+))New South Wales (Percent Imports (-) or Exports (+))Victoria (Percent Imports (-) or Exports (+))South Australia (Percent Imports (-) or Exports (+))Tasmania (Percent Imports (-) or Exports (+)) 1998-990.0-7.612.4-29.8 1999-000.0-7.910.4-27.7 2000-010.1-6.46.8-18.2 2001-023.9-9.05.8-10.2 2002-035.5-12.59.5-17.5 2003-048.9-10.35.8-20.0 2004-059.6-11.45.6-18.10.0 2005-0611.6-11.62.9-19.1-1.0 2006-0712.7-10.74.2-6.2-12.6 2007-0810.4-7.12.30.2-20.7 2008-099.4-7.27.4-1.4-23.2 2009-1010.7-9.77.7-4.2-10.1 2010-1112.7-12.88.3-3.92.3 2011-1210.5-11.09.2-8.0-2.5 2012-136.3-8.65.1-9.919.6 2013-143.8-8.35.7-12.329.9 2014-1511.1-15.318.3-12.0-13.6 2015-164.9-9.314.8-14.3-5.8 2016-176.4-10.216.6-20.9-3.5 2017-1810.1-8.20.63.02.1 2018-197.8-7.00.53.75.1 2019-208.2-7.61.23.45.2 2020-216.3-8.07.8-1.1-5.4 2021-222.7-6.89.2-5.52.9 2022-235.2-7.610.4-4.1-8.2 Download data as CSV Information Sector: ElectricitySegment: WholesaleCategory: Electricity interconnectionAER reference: 11048184Source: AER; AEMOOverview: 
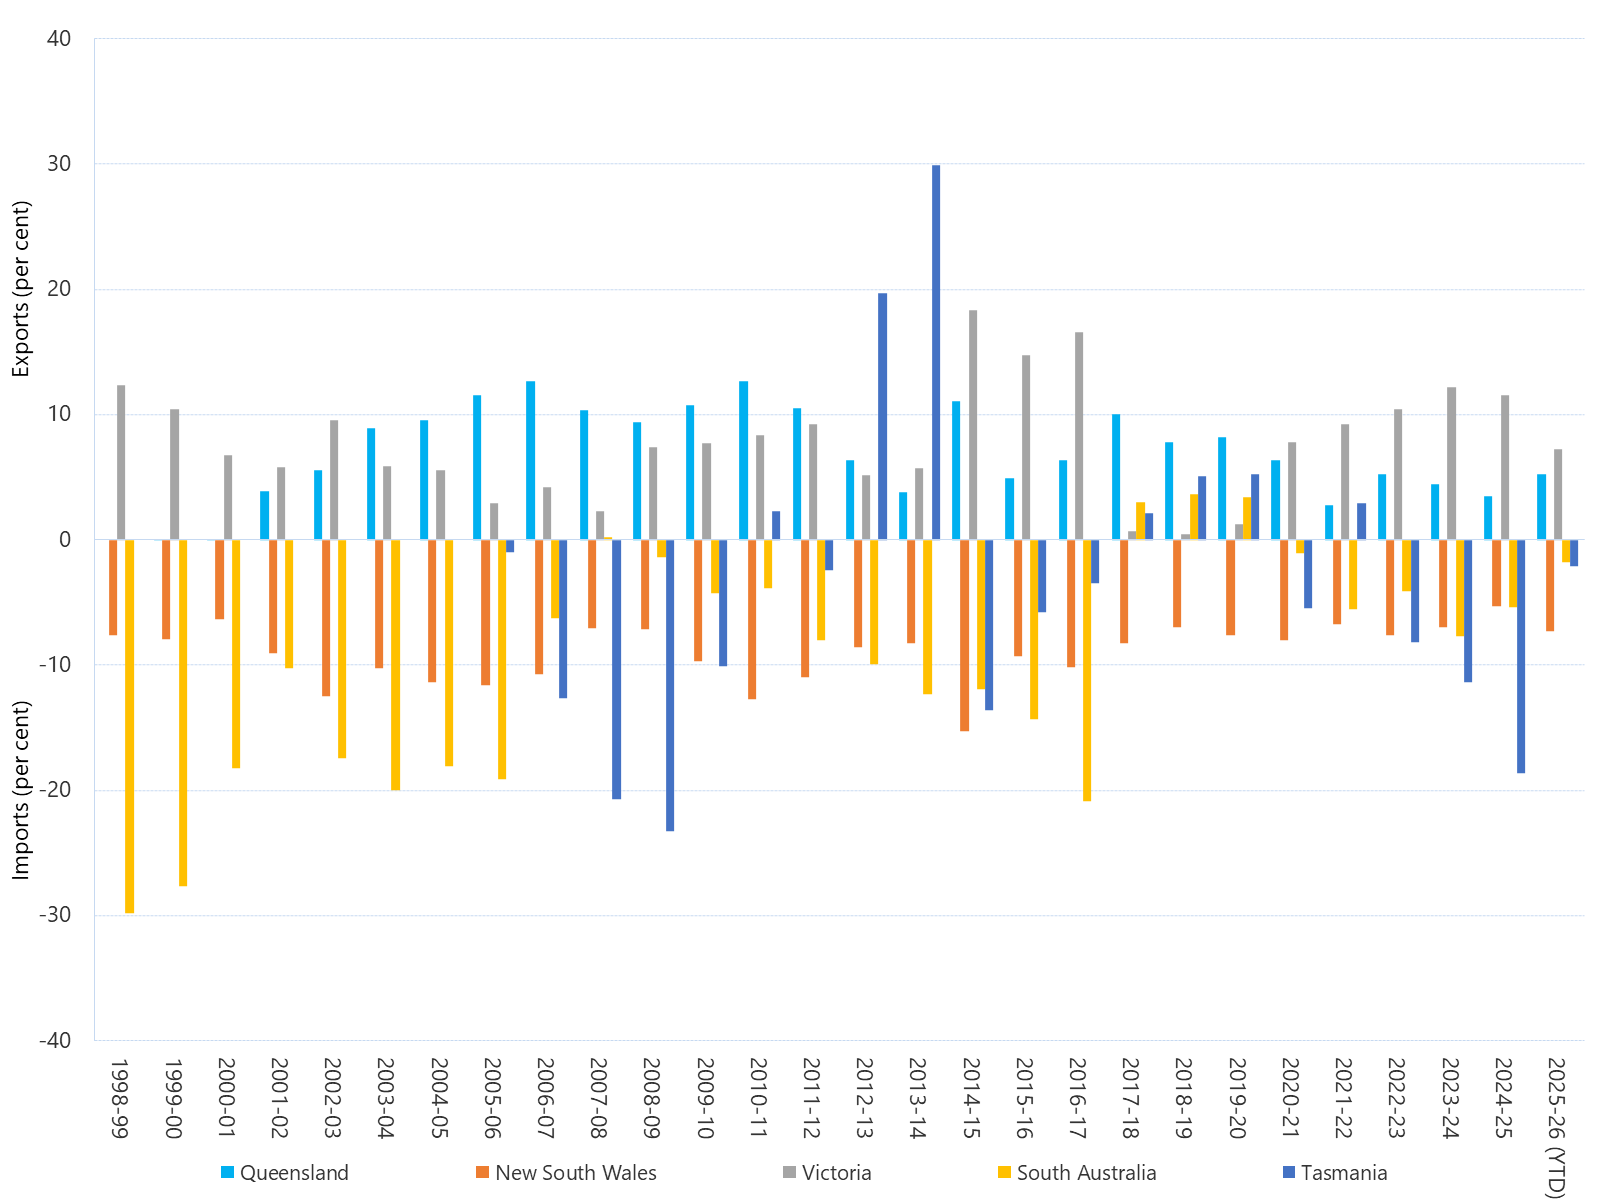
This figure presents the annual net trading positions of the regions since the NEM commenced. Note that the NSW and Victoria regions gained additional hydroelectric peaking capacity following the abolition of the Snowy region on 1 July 2008. Download:Download graphDownload data as CSV