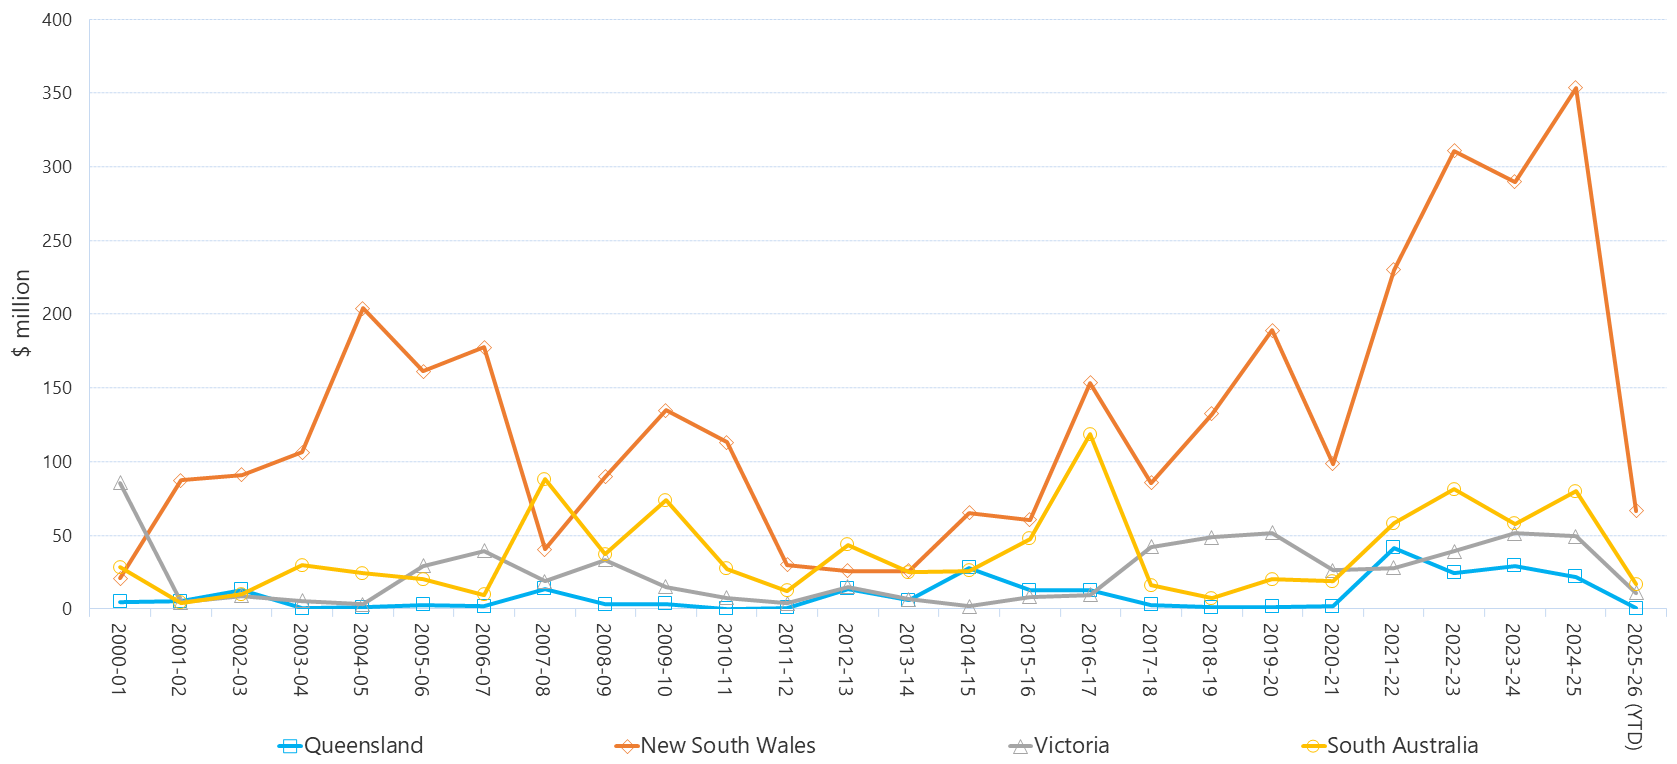
Price separation creates risks for parties that contract across regions. The difference between the price paid in the importing region and the price received in the importing region, multiplied by the amount of flow, is called a settlement residue. This figure shows the annual accumulation of interregional settlement residues in each region of the NEM. This data is always one quarter behind (includes Q3 2025).
Sector
Electricity
Segment
Wholesale
Categories
Electricity interconnection
Source
AER; AEMO
AER reference
11048184