Annual volume weighted average 30-minute prices - regions

Tabs

Graph
Data
Financial yearQueensland ($ per megawatt hour)New South Wales ($ per megawatt hour)Victoria ($ per megawatt hour)South Australia ($ per megawatt hour)Tasmania ($ per megawatt hour)Snowy ($ per megawatt hour)
1998-996025275419
1999-004930286924
2000-014541496735
2001-023838333427
2002-034137303327
2003-043137273922
2004-053146293926
2005-06314336445929
2006-07576761595138
2007-085844511015731
2008-093643496962
2009-103752428330
2010-113443294231
2011-123031283233
2012-137056617449
2013-146153546842
2014-156136324237
2015-166454506797
2016-17103887012376
2017-1875859910988
2018-19839212412888
2019-205679847356
2020-216672515345
2021-2217814410412590
2022-23 (YTD)164161121155135
Download data as CSV
Information
Sector: 
Segment: 
Category: 
Electricity spot prices
AER reference: 
11048184
Source: 
AER; AEMO
Overview: 

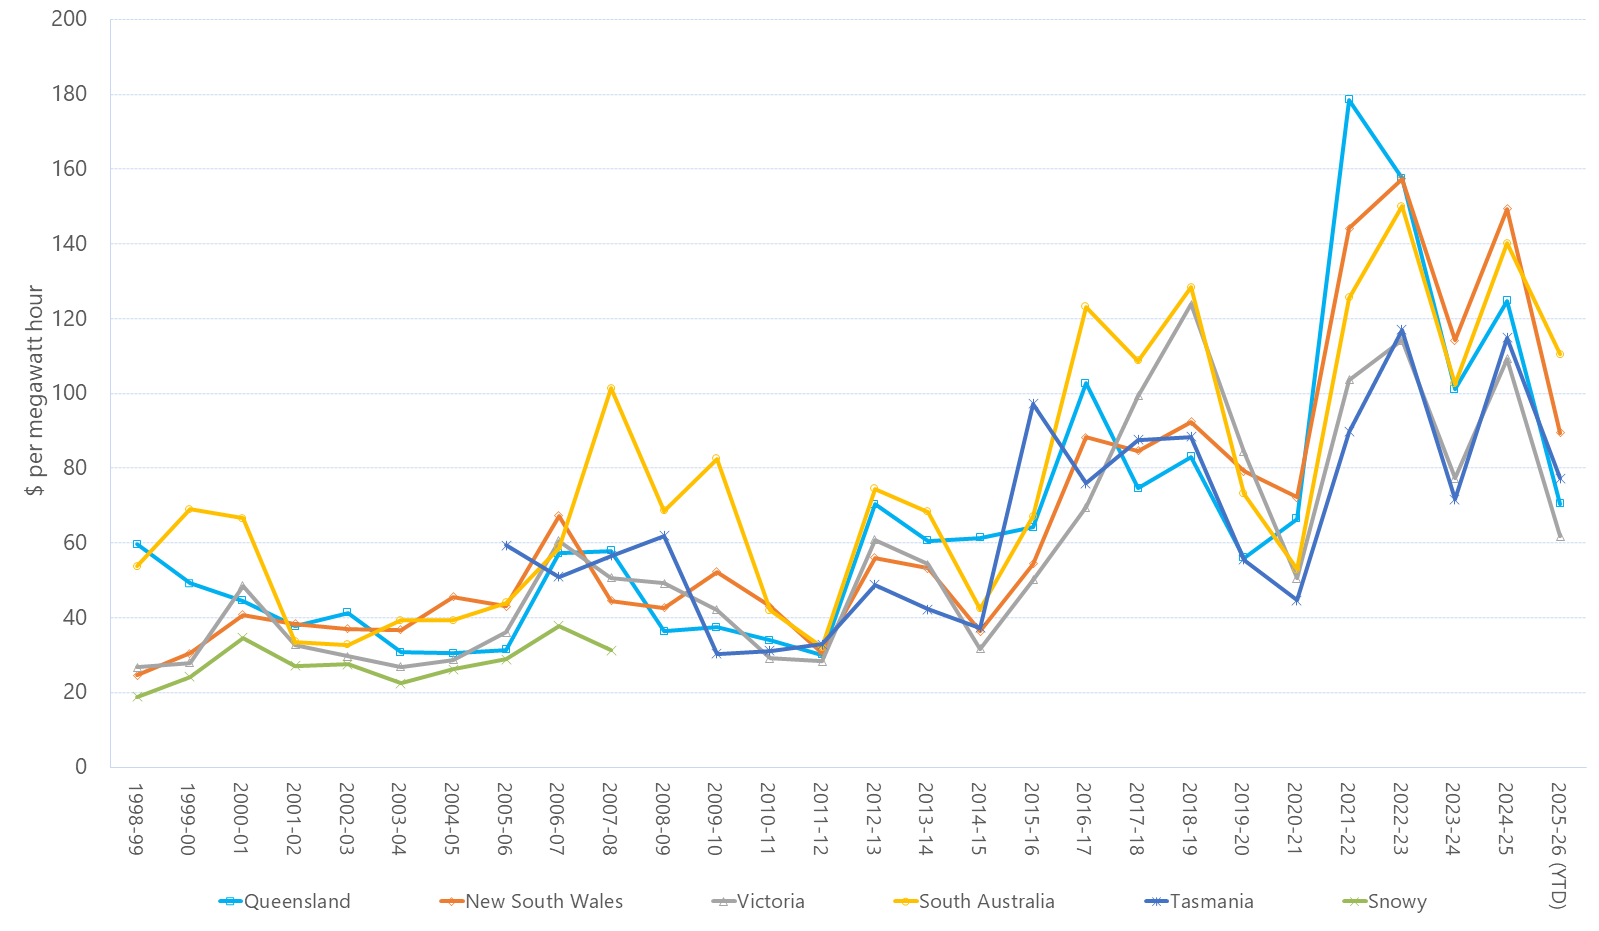
This figure presents the annual volume weighted average 30-minute electricity prices in each region of the NEM. The average is weighted against demand for electricity.