Average daily flows – QSN link and southerly flows towards Victoria (monthly)

Tabs

Graph
Data
Month endingNSW to Vic flows (Terajoules)QSN Link (Terajoules)
01/01/201302
01/02/201307
01/03/2013040
01/04/2013030
01/05/2013037
01/06/2013039
01/07/2013049
01/08/2013055
01/09/2013058
01/10/2013050
01/11/2013027
01/12/2013013
01/01/2014027
01/02/2014048
01/03/2014074
01/04/20149116
01/05/2014081
01/06/20146104
01/07/201418154
01/08/201424101
01/09/201423147
01/10/201443126
01/11/201424126
01/12/201420124
01/01/201522-2
01/02/2015720
01/03/20152064
01/04/20151674
01/05/2015065
01/06/201520154
01/07/2015468
01/08/201529113
01/09/2015819
01/10/20155-1
01/11/2015723
01/12/20159-95
01/01/20160-271
01/02/20160-231
01/03/20160-242
01/04/20160-157
01/05/20160-223
01/06/201611-132
01/07/20169-42
01/08/201618-53
01/09/201622-136
01/10/201614-250
01/11/20160-304
01/12/20160-303
01/01/20170-301
01/02/20170-291
01/03/20170-177
01/04/201721-81
01/05/20170-96
01/06/20172136
01/07/20172385
01/08/201731117
01/09/20174528
01/10/20175-207
01/11/20170-165
01/12/20170-252
01/01/20187-110
01/02/201816-15
01/03/20183314
01/04/201851-23
01/05/20182990
01/06/201845194
01/07/201856171
01/08/20184886
01/09/2018307
01/10/20185-131
01/11/20187-112
01/12/201821-72
01/01/201913-63
01/02/201914-42
01/03/201935-4
01/04/20194180
01/05/201977185
01/06/201965215
01/07/2019114262
01/08/2019101264
01/09/201955158
01/10/20192152
01/11/20195733
01/12/2019328
01/01/202013-33
01/02/2020377
01/03/202022-5
01/04/202025-19
01/05/202042172
01/06/2020104299
01/07/2020117323
01/08/202092246
01/09/20206565
01/10/202025-79
01/11/202025-123
01/12/20200-199
01/01/202113-161
01/02/202117-172
01/03/202115-131
01/04/202110-54
01/05/20212475
01/06/202137118
01/07/202145231
01/08/202142122
01/09/20210-121
01/10/20210-103
01/11/20210-187
01/12/202125-197
01/01/20223-201
01/02/202215-210
01/03/20220-218
01/04/20220-220
01/05/202225-87
01/06/202221207
01/07/202244204
01/08/202250187
01/09/202228-85
01/10/202210-149
01/11/202243-161
01/12/202243-131
Download data as CSV
Information
Sector: 
Segment: 
Category: 
Gas pipeline flow
AER reference: 
D11/2298801[V4]
Source: 
AEMO; AER
Overview: 

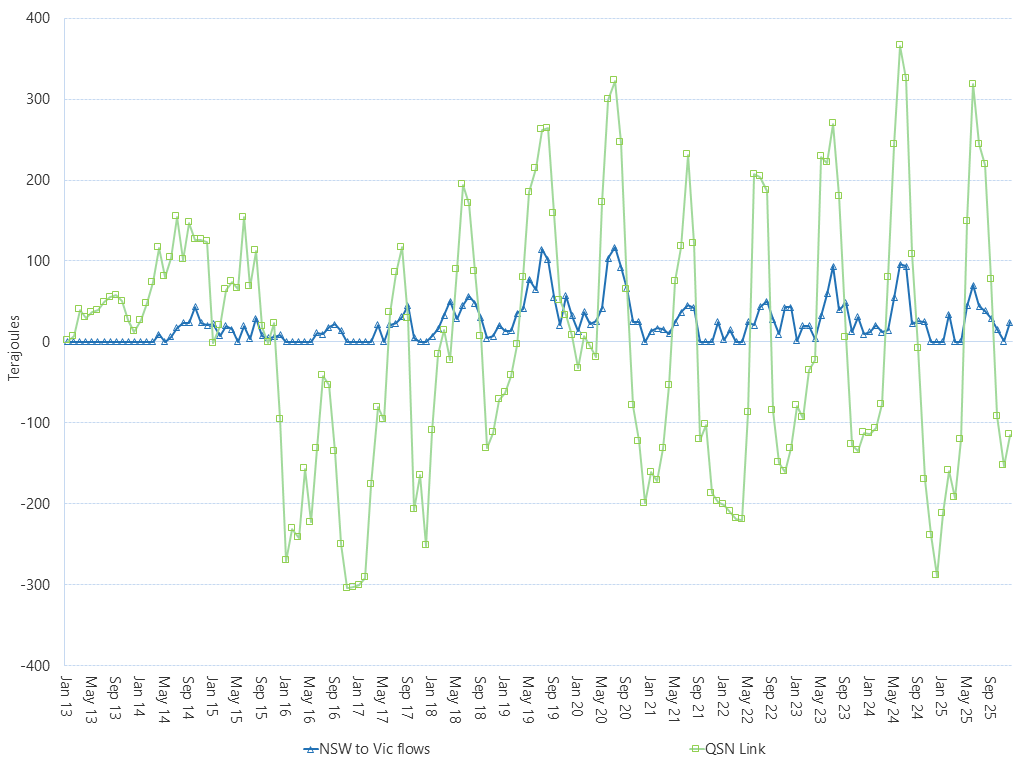
This figure shows Bulletin Board average daily gas flows by month on the ‘Moomba (MOO)’ zone of the ‘South West Queensland Pipeline’ facility (a.k.a. QSN Link), and southerly flows on the ‘NSW-Victoria Interconnect’ pipeline facility.

The default flow direction on the South West Queensland Pipeline is from east to west, with negative QSN Link flows representing the gas flowing north from Moomba towards Queensland.

The values provided for the flows south from New South Wales to Victoria are an average of the quantity of gas flowed south, averaged across only the gas days where southerly flows occurred.