Tabs Graph Download graph Data Quarter EndingBass Gas (Terajoules)Culcairn (Terajoules)Iona (Terajoules)Longford (Terajoules)Otway (Terajoules)SEA Gas (Terajoules)VicHub (Terajoules)Mortlake (Terajoules) 30/09/20086201106890631 31/12/2008301193999432 31/03/20094709823427272 30/06/200953121074988590 30/09/200957341275280611 31/12/20093135733282923 31/03/201001343230193627 30/06/201047212146504423 30/09/201050111065004727 31/12/2010452672750193816 31/03/201145023319122117 30/06/2011490974720135049 30/09/2011460113526062490 31/12/201140021345016420 31/03/20120055248434270 30/06/201211123532047320 30/09/20121083699011570 31/12/201240022372011310 31/03/20134001630002280 30/06/201339077533051230 30/09/201354093567021327 31/12/201348048318082456 31/03/201443011284131819 30/06/2014431624860112824 30/09/20143811105566046195 31/12/20142126132880162923 31/03/2015254342530151727 30/06/2015334695360441728 30/09/2015415108672056822 31/12/201553211330016810 31/03/2016470139501281 30/06/201647159579019162 30/09/2016453496940222425 31/12/2016311214310192548 31/03/20174102425019722 30/06/201738246649027913 30/09/20174514597420431224 31/12/2017520852607103 31/03/2018458633201877 30/06/2018471960548034163 30/09/20184238104609036191 31/12/20183525409015228 31/03/20193932334507275 30/06/2019265746566010265 30/09/20192188103638016331 31/12/201927141346102270 31/03/20203210834100150 30/06/2020325136571011370 30/09/202027924465104330 31/12/20202322242202281 31/03/2021222437807181 30/06/2021191010061003133 30/09/202117216471106210 31/12/20211014144509301 31/03/20221311414025510 30/06/202211293630054588 30/09/2022102466717032612 31/12/2022876437024644 31/03/20231146326026340 Download data as CSV Information Sector: GasSegment: WholesaleCategory: Gas pipeline flowAER reference: D11/2298801[V6]Source: AER; AEMOOverview: 
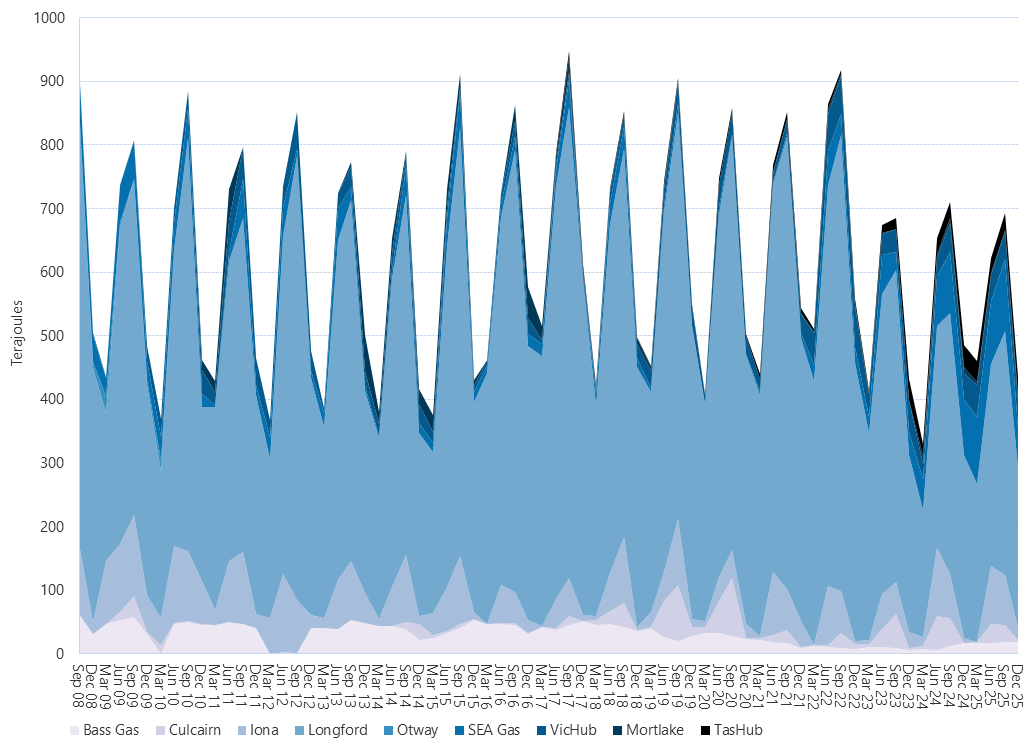
This figure shows the source of gas supplied to the Victorian Gas Market as average daily flows for each quarter. Download:Download graphDownload data as CSV