Tabs Graph Download graph Data MOS Period EndingAdelaide ($)Brisbane ($)Sydney ($) 30/11/2010810521173 28/02/20111369925277 31/05/20113203253595 31/08/20111392753361 30/11/20111084540792 29/02/2012135621166033401 31/05/20126057857924395 31/08/20128990398933432 30/11/20121004624009029 28/02/20137475185610874 31/05/20131201520879552 31/08/201325706176611339 30/11/201313859152012425 28/02/201416405165011122 31/05/2014856214825716 30/06/20141565210318451 31/07/2014823489419519 31/08/201422802108520893 30/09/201412546135516719 31/10/20141347811538145 30/11/2014667913988320 31/12/20144139130712104 31/01/20152830832749524 28/02/201517182100712496 31/03/201510508267413674 30/04/20156836223817982 31/05/201511671233426426 30/06/201515386253936274 31/07/201517067133034172 31/08/20159285170028355 30/09/201513731119215880 31/10/20154315125016452 30/11/20154415122619399 31/12/20155457230132087 31/01/20167405233172343 29/02/20164570117325230 31/03/20168811155325091 30/04/201611006131012442 31/05/201615378182821193 30/06/201635015111832852 31/07/201614964119783107 31/08/201620596176973851 30/09/201648164109643528 31/10/201624973163952278 30/11/201640240175255398 31/12/201611504171150105 31/01/20175484202034585 28/02/20174240157742163 31/03/201710255218821572 30/04/201715218201127712 31/05/20175711136965133 30/06/20176497155756977 31/07/20177411184666777 31/08/20178661174144959 30/09/20179099201131043 31/10/20174662601515138 30/11/20176361209722080 31/12/20172856198519633 31/01/20184031214720435 28/02/20183794152921697 31/03/20182987185425520 30/04/20185371141042187 31/05/20183478154730839 30/06/20185819101524756 31/07/20184598132928128 31/08/20184999154520948 30/09/20188447122126169 31/10/2018352497926369 30/11/2018275757415139 31/12/201833329539625 31/01/20193731167314600 28/02/20191955114411891 31/03/2019245065911952 30/04/2019404388922831 31/05/20196733649024782 30/06/20197408137230778 31/07/2019470675944515 31/08/20197942118122661 30/09/20195270223421078 31/10/20192319232012065 30/11/20193372110212038 31/12/20194222190617657 31/01/20204391221224563 29/02/20202273229710495 31/03/20202697119017785 30/04/20204006123824838 31/05/20203161103117612 30/06/20206343186227619 31/07/20202017470220457 31/08/20204485171825007 30/09/2020498165721413 31/10/202064913023718134 30/11/20201031660924004 31/12/202010128113025493 31/01/20214391138113538 28/02/2021395247113128 31/03/2021393494814372 30/04/2021969998317992 31/05/20216641132818348 30/06/2021587398627540 31/07/2021456065932390 31/08/2021454291927647 30/09/2021456792825098 31/10/2021528661821424 30/11/20211094084613364 31/12/202119350121117951 31/01/202255196017092 28/02/20224311130212476 31/03/20227184110718877 30/04/20221487976920250 31/05/202215949121336830 30/06/2022920567943326 31/07/202212020168945893 31/08/20228883106132938 30/09/20221630494130256 31/10/20229436222725799 30/11/20228838152624783 31/12/20224452173815870 31/01/202386041894120710 28/02/202310256143917816 31/03/2023524164325412 30/04/202320568279826463 31/05/202315439241544233 30/06/20231320386041221 Download data as CSV Information Sector: GasSegment: WholesaleCategory: Gas market operator servicesAER reference: D11/2298801[V6]Source: AER; AEMOOverview: 
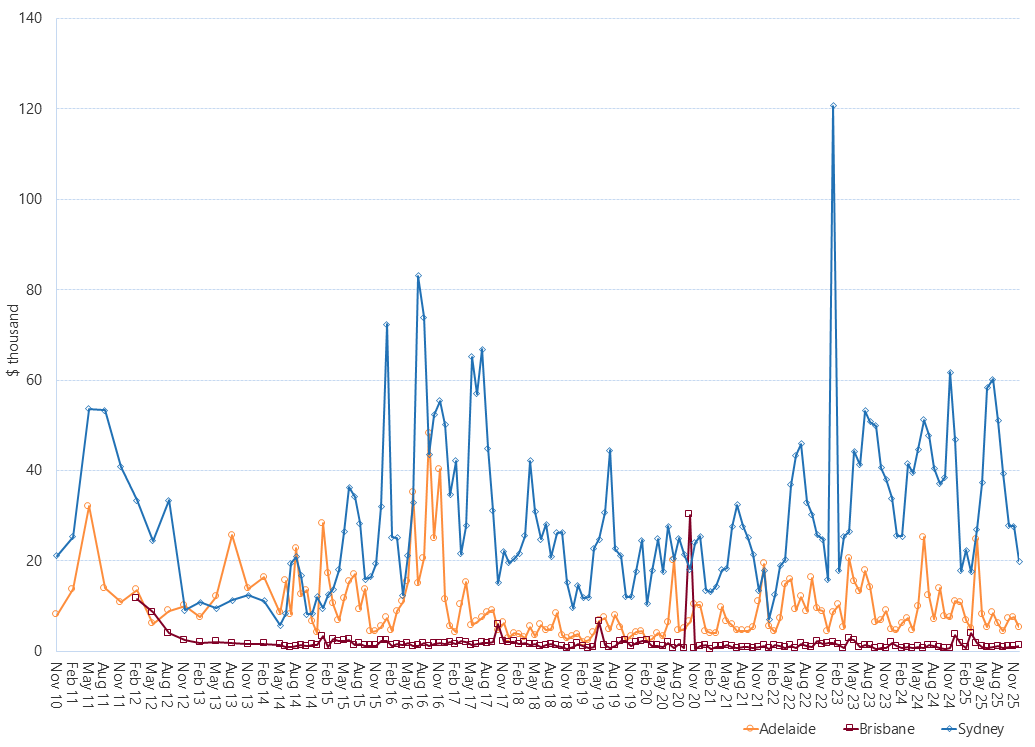
This figure shows average daily MOS service payments by month (MOS offers covered seasonal quarterly periods until 31/5/2014) for each STTM hub. Download:Download graphDownload data as CSV