Average daily production for production points

Tabs

Graph
Data
Month commencing Roma (QLD) (Terajoules) Ballera - Ballera Gas Plant (QLD) (Terajoules) Iona WUGS - Otway Basin (VIC) (Terajoules) Athena - Otway Basin (VIC) (Terajoules) Lang Lang - Eastern Victoria (Terajoules) Longford - Eastern Victoria (Terajoules) Minerva - Otway Basin (VIC) (Terajoules) Otway - Otway Basin (VIC) (Terajoules) Orbost - Eastern Victoria (Terajoules) Moomba - Moomba (SA/QLD) (Terajoules) Camden CSM (NSW) (Terajoules) Mereenie - Northern Territory (NT) (Terajoules) Palm Valley - Northern Territory (NT) (Terajoules) Yelcherr Gas Plant - Northern Territory (NT) (Terajoules)
Jan 1351332254157869119817615
Feb 1354716594356575129018815
Mar 1352232283860669132014015
Apr 1351821132371552144015515
May 1356501454782560113522315
Jun 13579020648970711154527214
Jul 13584017642952681323424514
Aug 13586117664894671423419913
Sep 1355818155679611563416713
Oct 1358007353610431563316914
Nov 1358837247532661423017213
Dec 1353878742481571572813713
Jan 14586185046539561212813413
Feb 14614153546536521272012213
Mar 1463871739518561282310914
Apr 1463383245598521393212014
May 1464808443765571353320513
Jun 146771616841863721223423113
Jul 146992816440884781511524913
Aug 146152016939850801252325712
Sep 14570265037663731232421012
Oct 1475112-1036468421262422011
Nov 1480815-1917481651092222512
Dec 1490792810388401091918512
Jan 15101530-2037527481111915112
Feb 151094116730430651191817311
Mar 151062287946964831814912
Apr 1512443813361148110181479
May 15138167535819531121716812
Jun 15141751373195767110018912
Jul 1515881293369937299022213
Aug 15155801273696772117020513
Sep 1518490725189848106017713
Oct 1520360-19515854186019212
Nov 152166024555933898018612
Dec 152436058535574287023412
Jan 162743036526503475031112
Feb 16267408407183173026212
Mar 16285302247822350028012
Apr 16276202650802359502408
May 162816082519543764030012
Jun 16314302214210245499037613
Jul 16306301434610225588036613
Aug 1631930784310204881030413
Sep 1632520154796239123024912
Oct 1632980494588740152030912
Nov 1633370372280940162034512
Dec 1632630652755040148033612
Jan 1734220434375536116032112
Feb 1733680424180243151031812
Mar 1734030454071941158025511
Apr 173380022358074317602345
May 17356403237102242177027111
Jun 1735880643111343186027112
Jul 17364802541111243176027411
Aug 17347902749111443162023411
Sep 17363404246106041145023011
Oct 1734230305595137116024711
Nov 1737050294792837115025311
Dec 173722017548523882028211
Jan 1836990204860234115025611
Feb 183673020475913471025311
Mar 1836530234048332125021911
Apr 1836100154965630107020810
May 1834820164780431118022711
Jun 1837500164789530138024811
Jul 1836900264290931131027311
Aug 1837270233991829139028511
Sep 1837680214589025135026611
Oct 1836610133277123124026511
Nov 1837540274264633138026610
Dec 1839240313552744116025810
Jan 1939700304159335118026010
Feb 1939890314064719114024711
Mar 1939350303653322110024811
Apr 1939820203259525940226951695
May 193959030229051912202271150897
Jun 193974038249704199027010441289
Jul 194016039109305410602471037986
Aug 19399903720940471090286104410104
Sep 194134037358752106026510399101
Oct 194208020278130890272104112104
Nov 194098033306740930248104112106
Dec 194075033335610860242104012105
Jan 20416401543469086027810281289
Feb 2040780312651807402969261091
Mar 20399202534504051328910261193
Apr 20415003140568056182899261189
May 20384803333796067172838251078
Jun 204009031348680813127710271187
Jul 204031029339120923627810281085
Aug 20386102927935081212809291088
Sep 20404402230760047272778301097
Oct 2041850262472106822249922982
Nov 20428402924615023142669339101
Dec 2042590282760707717266929994
Jan 2141820322760705228267932986
Feb 2142260291960005239273932890
Mar 2141060312753605142258928889
Apr 214218062572207531263831889
May 2140580252186505633247929882
Jun 2140740182093609335250829882
Jul 2141460212192009440258831880
Aug 2141070292097408041251831789
Sep 2142360241988806835288831780
Oct 2142070231777805135229834686
Nov 214231010563407942240830686
Dec 214169001313625010144228832762
Jan 22414200271964007147229834772
Feb 22414300272172207745225833667
Mar 2241380029276108440222733664
Apr 22417400220843014130221732664
May 224084002615934014356211729543
Jun 2238840026211012013745217731656
Jul 2239330024201035012849216731656
Aug 22406900258987011449219731652
Sep 22405200269928011956219623646
Oct 22397600251383808746224620542
Nov 2240340017770708740228626536
Dec 223784001612604093442296271120
Jan 233880002315462094432066291437
Feb 2339950013155130101491826301326
Mar 233762002510527042492536201233
Apr 23422700248589089422376251224
May 2342750013146980122442466291025
Jun 2341820025156820138522576301156
Download data as CSV
Information
Sector: 
Segment: 
Category: 
Gas production
AER reference: 
D11/2298801[V4]
Source: 
AER; AEMO
Overview: 

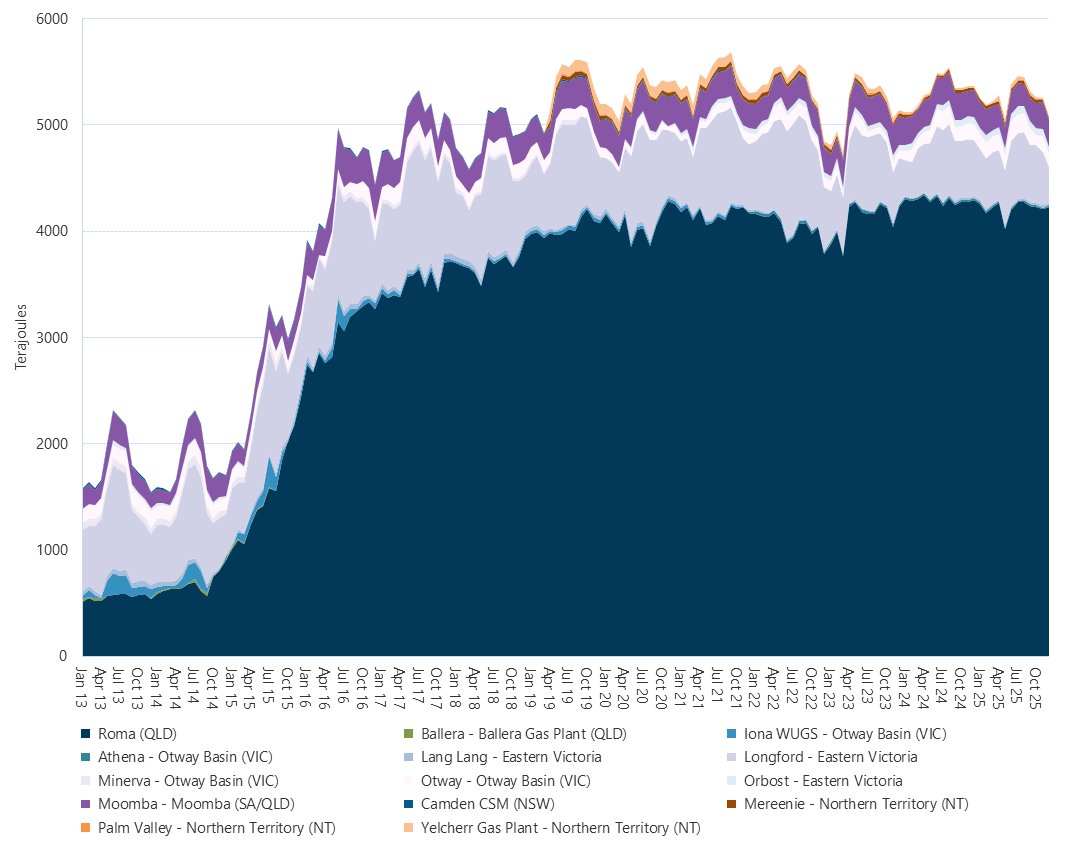
This figure shows average daily Bulletin Board production by month grouped by major regional production points.

NOTES:

Net flow data for the Iona Underground Gas Storage facility has been revised to provide an estimate of Casino offshore gas production quantities being processed at the facility. These estimates commence from October 2016. Data prior to this shows average net flow (supply) quantities into the Victorian gas market. 

Bulletin Board data has been updated to include revised production quantities from October 2018. Average daily production now includes facilities located in the Northern Territory.* Data for a number of production facilities has been back-dated, using pipeline receipt data, for periods prior to the commencement of those facilities reporting production data to the Bulletin Board. 

* Northern Territory production data prior to April 2019 is unavailable.