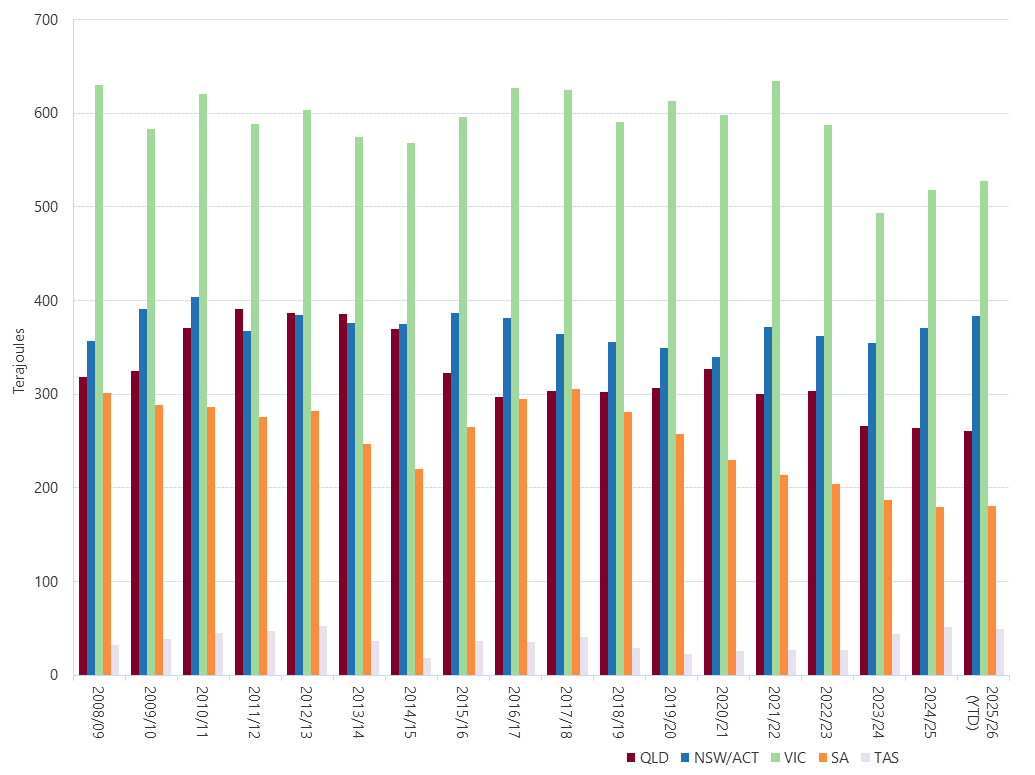
This figure shows average daily regional Gas Bulletin Board demand by financial year (SA = MAP + SEAGAS, NSW/ACT = EGP + MSP, TAS = TGP, QLD = RBP + CGP + QGP, VIC = SWP + LMP adjusted for imports from Vic-NSW interconnector). YTD data is current at 1 January 2026.
NOTE: Bulletin Board data has been updated to include revised production quantities from October 2018. A template error in the Bulletin Board demand calculation for 2018/19 has been corrected. This largely impacted calculated estimates for southern regions, in particular Victorian demand.
The regional demand estimates use aggregated pipeline flows for historical comparison going back to the commencement of the Bulletin Board in July 2008. For more accurate regional demand figures, AEMO has recently published a Pipeline Connection Point Mapping on the procedures, policies and guides section of their website. The mapping file can be used to generated regional demand figures since publication of connection point data commenced from October 2018.