Tabs Graph Download graph Data QuarterSETTLEMENTDAYQueensland ($ per megawatt hour)New South Wales ($ per megawatt hour)Victoria ($ per megawatt hour)South Australia ($ per megawatt hour)SETTLEMENTDAYQueensland 1 ($ per megawatt hour)New South Wales 1 ($ per megawatt hour)Victoria 1 ($ per megawatt hour)South Australia 1 ($ per megawatt hour) 2021 Q231/03/202046.154.849.748.531/03/202133.843.033.234.0 2021 Q331/03/202046.254.546.144.131/03/202135.746.536.334.0 2021 Q431/03/202048.754.545.943.931/03/202139.348.230.830.7 2022 Q131/03/202061.573.575.083.031/03/202152.158.148.849.0 2022 Q231/03/202044.254.944.246.531/03/202132.944.332.631.0 2022 Q331/03/202043.954.143.647.031/03/202133.246.233.532.0 2022 Q431/03/202046.653.943.751.531/03/202136.646.129.330.5 2023 Q131/03/202061.068.864.277.531/03/202150.056.746.448.7 Download data as CSV Information Sector: ElectricitySegment: WholesaleCategory: Electricity contract pricesAER reference: 11048184Source: AER;ASX EnergyOverview: 
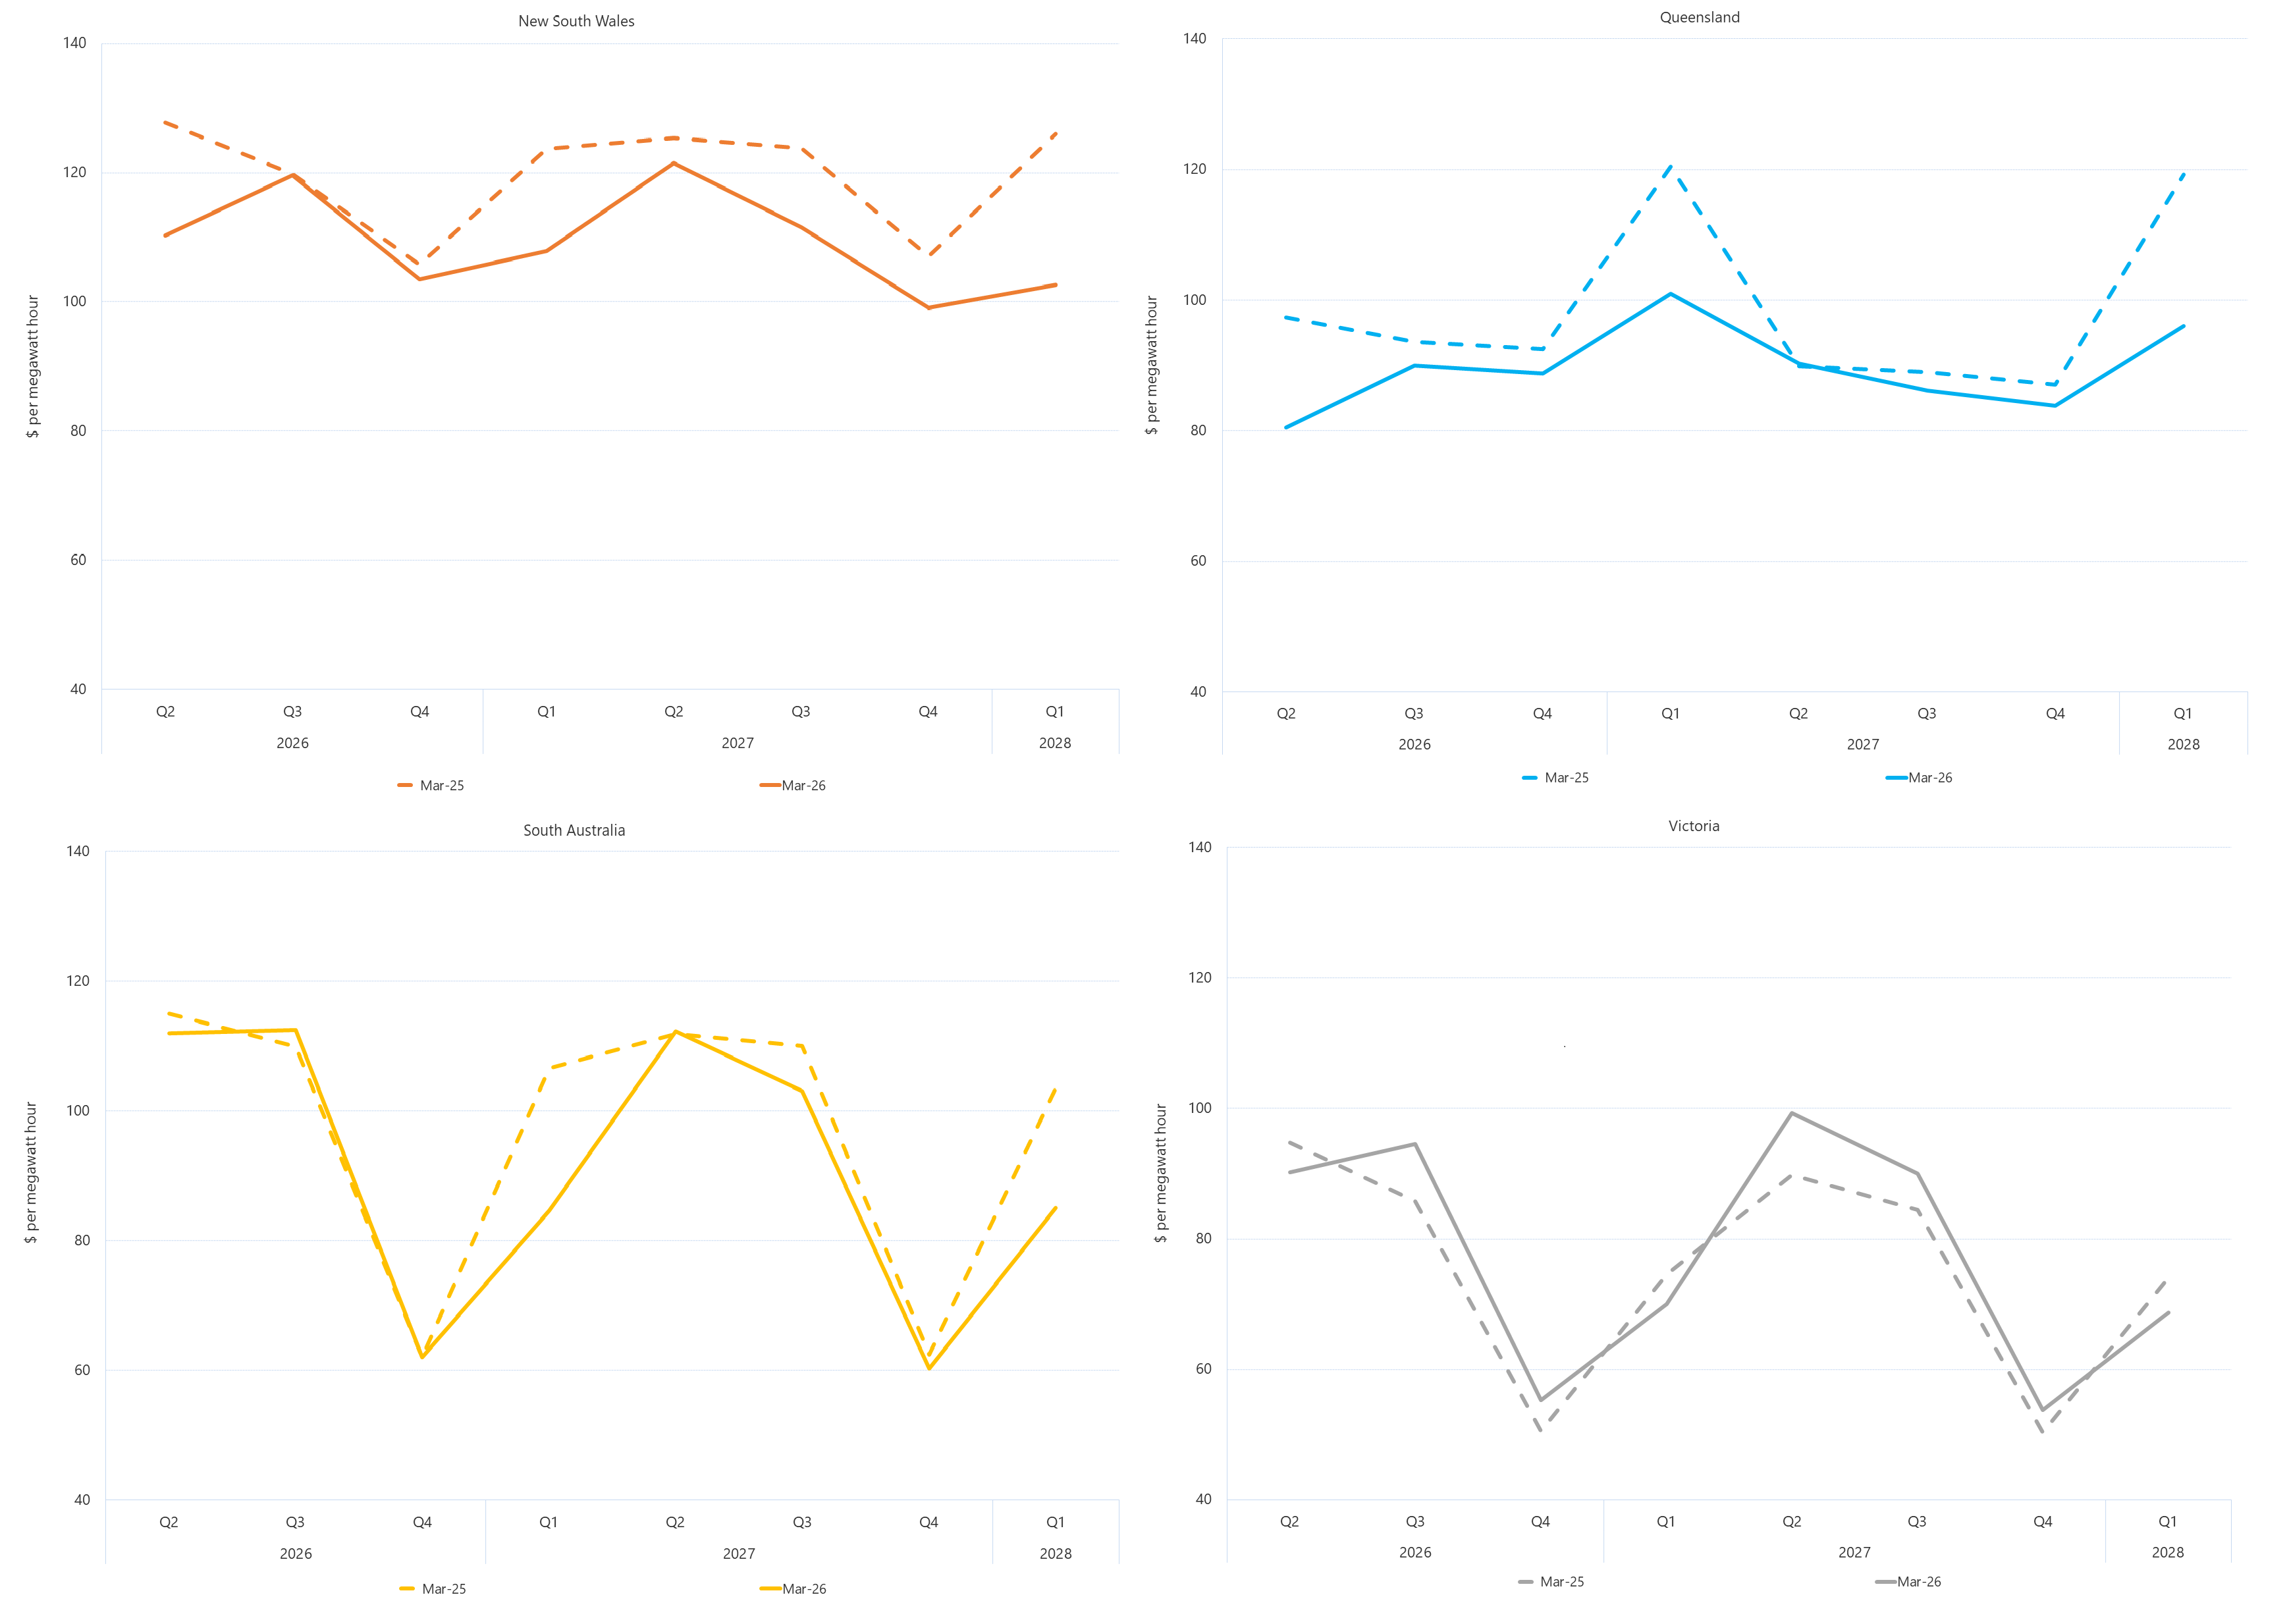
This figure compares quarterly base futures prices as at the dates shown at the bottom of the graph. Download:Download graphDownload data as CSV