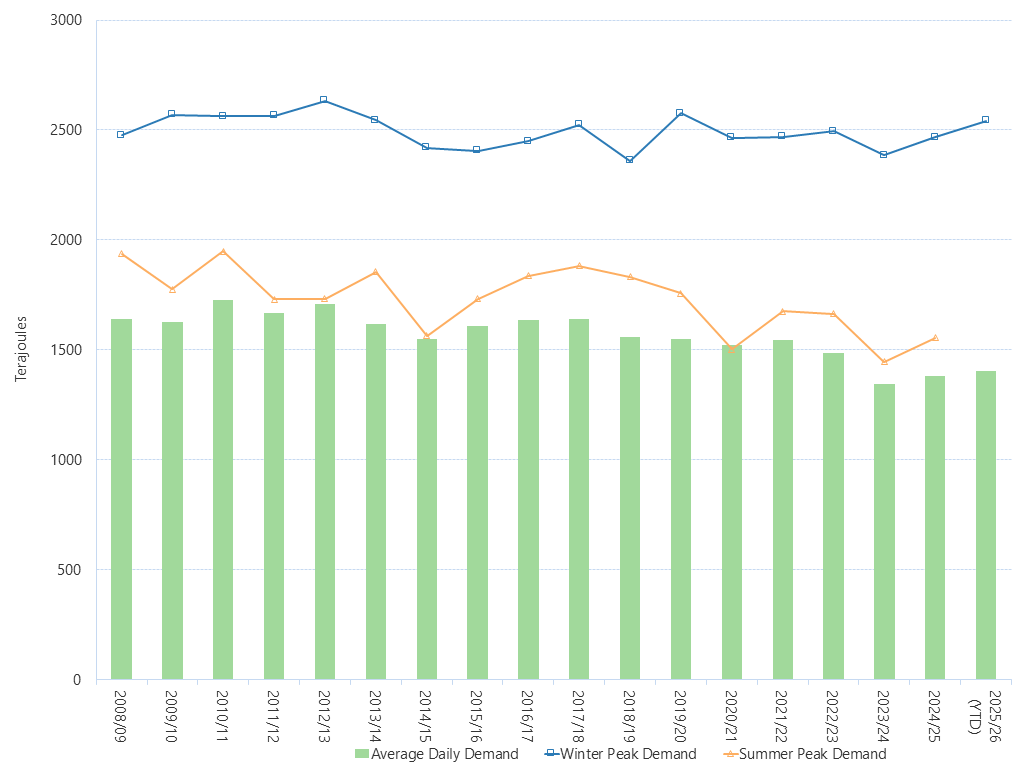
This figure shows average daily Gas Bulletin Board demand by financial year (QLD + NSW/ACT + VIC + SA + TAS), including winter peak day and summer peak day demand. YTD data is current at 1 January 2026.
NOTE: Bulletin Board data has been updated to include revised production quantities from October 2018. A template error in the Bulletin Board demand calculation for 2018/19 has been corrected. This largely impacted calculated estimates for southern regions, in particular Victorian demand.
Bulletin Board data has been updated to include revised connection point data on the SEAGas pipeline:
- 1505012 Pelican Point - PCA (decommissioned 1 April 2019)
- 1505088 Pelican Point Delivery - PS
- 1505089 Point Delivery - MAPS
Refer to the Average daily regional demand figure for notes on regional demand calculations.