Gas Supply Hub trade count by product – Moomba

Tabs

Graph
Data
Month beginningBalance of day - Exchange (Number of trades)Day ahead - Exchange (Number of trades)Daily - Exchange (Number of trades)Weekly - Exchange (Number of trades)Monthly - Exchange (Number of trades)Balance of day - Off market (Number of trades)Day ahead - Off market (Number of trades)Daily - Off market (Number of trades)Weekly - Off market (Number of trades)Monthly - Off market (Number of trades)
01/06/20160000000000
01/07/20160000000000
01/08/20160000000000
01/09/20160000000000
01/10/20160000000000
01/11/20160000000000
01/12/20160000000000
01/01/20170000000000
01/02/20170000000000
01/03/20170000000000
01/04/20170000000000
01/05/20170000000000
01/06/20170000000000
01/07/20170000000000
01/08/20170000000000
01/09/20170010000000
01/10/20170000000000
01/11/20170000010000
01/12/20170000000000
01/01/20180000000000
01/02/20180000000000
01/03/20180000000000
01/04/20180000000000
01/05/20180000000100
01/06/20180000001100
01/07/20180000031000
01/08/20180000000000
01/09/20180000000000
01/10/20180000001200
01/11/20180000000000
01/12/20180000000000
01/01/20191110000000
01/02/20190000000000
01/03/20190000000000
01/04/20190000002000
01/05/201903700061643
01/06/201913920401411
01/07/20190300000000
01/08/201913910001100
01/09/20190000001300
01/10/20190000022320
01/11/20190000024000
01/12/201900000110400
01/01/20201210001100
01/02/20200200001000
01/03/20200000042300
01/04/20200000000000
01/05/20200000001100
01/06/20200100001002
01/07/20200300036610
01/08/20200342000000
01/09/20202000000000
01/10/20201000010000
01/11/20200000011010
01/12/20200000001100
01/01/20211000000000
01/02/20210100000000
01/03/20210000000000
01/04/20210000000000
01/05/20210000000000
01/06/20210000000000
01/07/20211000000000
01/08/20210000000000
01/09/20210000000000
01/10/20210000002022
01/11/20210200000000
01/12/20210000000100
01/01/20222200000000
01/02/20221000020100
01/03/20220000002000
01/04/20221000002000
01/05/20220000000000
01/06/20222100000000
01/07/20220100000103
01/08/20220000041200
01/09/20220000000401
01/10/20220000011000
01/11/20220000020000
01/12/20222020001000
01/01/20230000030000
01/02/20232000015501
01/03/20231000004203
01/04/20231200045200
01/05/20230300010571600
01/06/20233600019382104
Download data as CSV
Information
Sector: 
Segment: 
Category: 
Gas liquidity (GSH)
AER reference: 
D11/2298801[V6]
Source: 
AER; AEMO
Overview: 

To supplement the voluntary gas supply hub located at Wallumbilla, the Moomba hub was established from 1 June 2016 to facilitate trade on the Moomba to Adelaide Pipeline (MAP) and Moomba to Sydney Pipeline (MSP). A spread product also allows for trading between the Wallumbilla and Moomba markets on the SWQP (representing the price differential between the two hubs at the MSP and WAL trading locations).

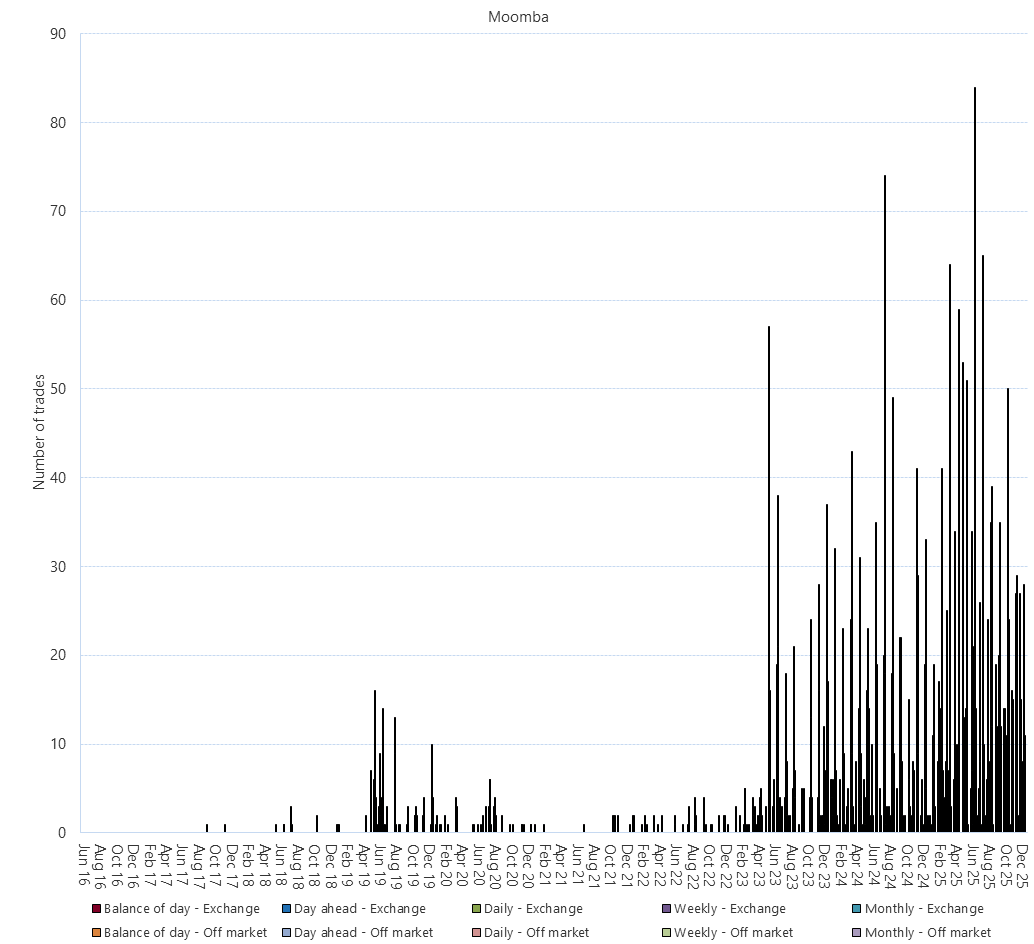
This figure shows the number of trades which were settled through the exchange each month at the Moomba hub. The numbers of trades are split by their on/off market status, and by product: Intra-day (Balance-of-day); Day-ahead (both netted and non-netted products); Daily; Weekly; and Monthly.

Note: Corrections have been made to include a small number of MOO Not-netted trades previously missing from the AER dataset.