Grid-scale solar output as a percentage of total output - regions

Tabs

Graph
Data
Financial yearQueensland (Percent of regional output)New South Wales (Percent of regional output)Victoria (Percent of regional output)South Australia (Percent of regional output)Tasmania (Percent of regional output)
2014-150.05
2015-160.56
2016-170.030.86
2017-180.221.000.020.03
2018-192.511.820.882.34
2019-205.222.721.553.83
2020-215.444.522.495.74
2021-226.206.953.206.33
2022-238.948.693.257.20
Download data as CSV
Information
Sector: 
Segment: 
Category: 
Electricity generation
AER reference: 
11048184
Source: 
AER; AEMO
Overview: 

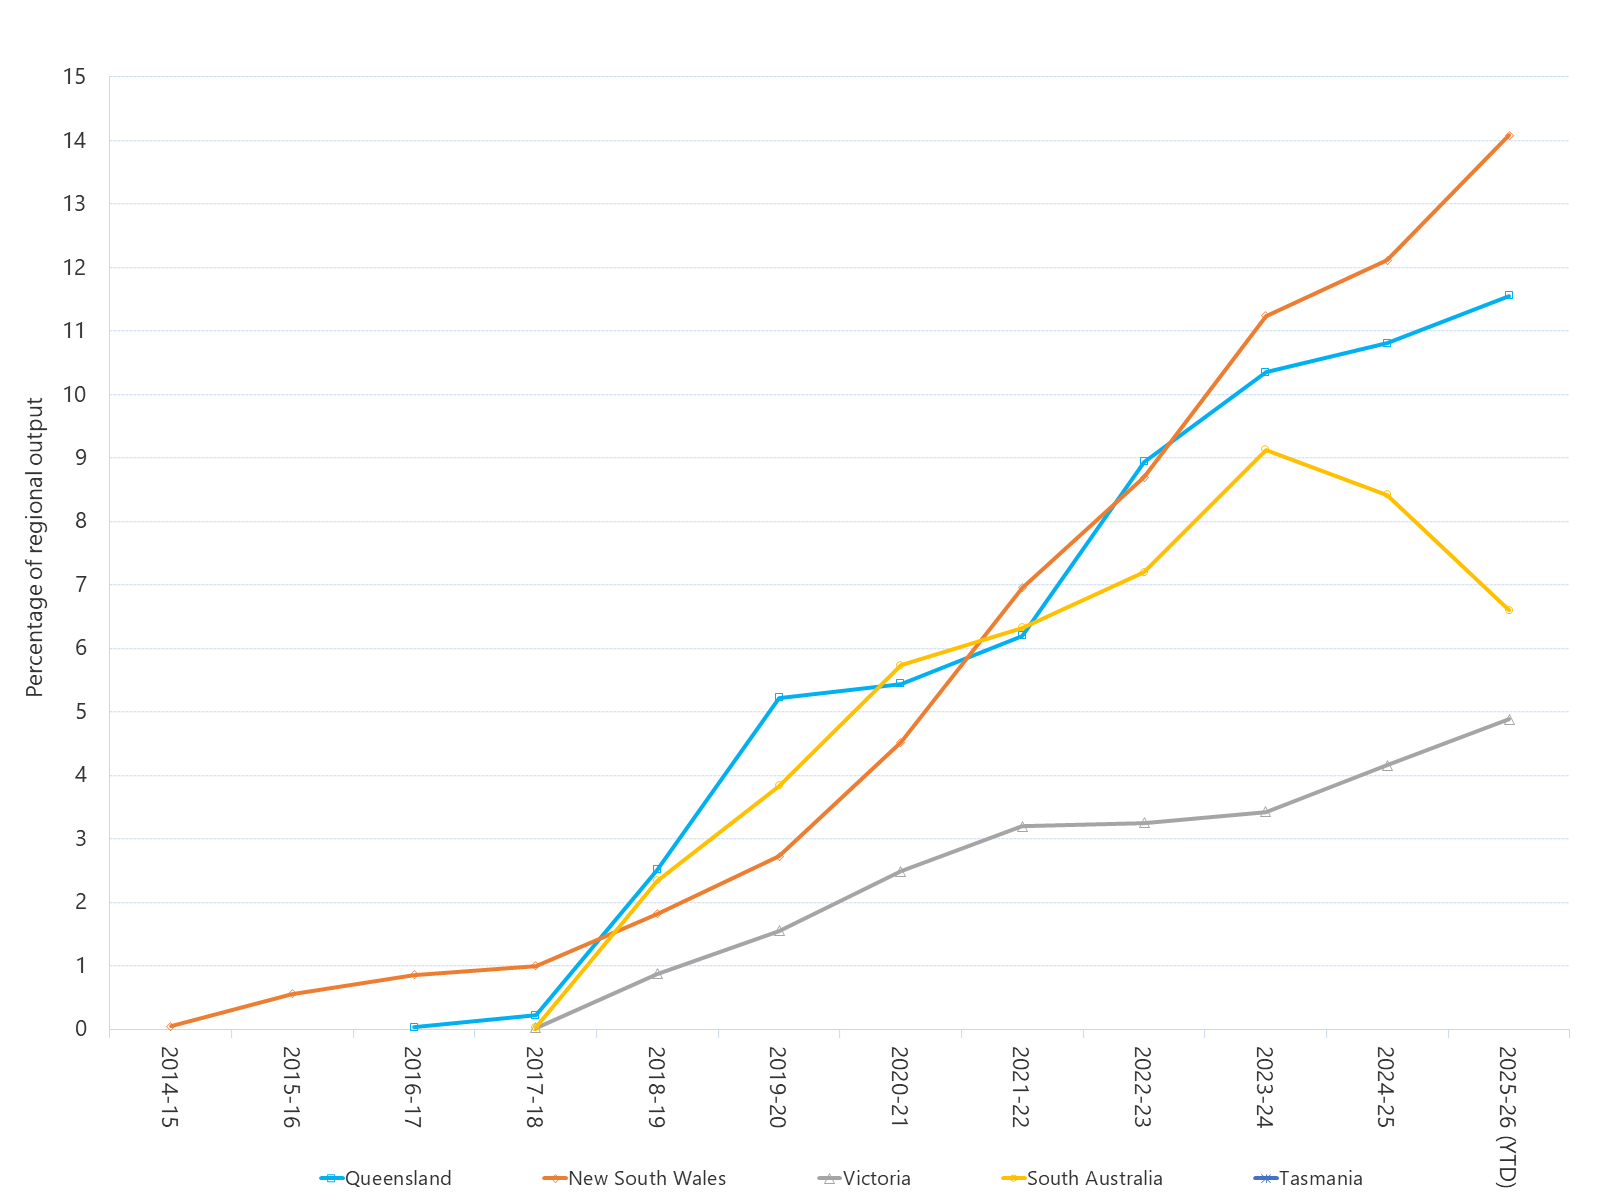
This figure shows the percentage of output grid-scale solar contributes to total output in each region since 2014-15 FY.