Moomba Gas Supply Hub - monthly trade activity by participant

Tabs

Graph
Data
Month endingTotal (Number of participants trading)Buyers (Number of participants trading)Sellers (Number of participants trading)
30/06/2016000
31/07/2016000
31/08/2016000
30/09/2016000
31/10/2016000
30/11/2016000
31/12/2016000
31/01/2017000
28/02/2017000
31/03/2017000
30/04/2017000
31/05/2017000
30/06/2017000
31/07/2017000
31/08/2017000
30/09/2017211
31/10/2017000
30/11/2017211
31/12/2017000
31/01/2018000
28/02/2018000
31/03/2018000
30/04/2018000
31/05/2018211
30/06/2018211
31/07/2018211
31/08/2018000
30/09/2018000
31/10/2018211
30/11/2018000
31/12/2018000
31/01/2019222
28/02/2019000
31/03/2019000
30/04/2019321
31/05/2019643
30/06/2019866
31/07/2019211
31/08/2019433
30/09/2019312
31/10/2019433
30/11/2019211
31/12/2019422
31/01/2020422
29/02/2020323
31/03/2020211
30/04/2020000
31/05/2020211
30/06/2020422
31/07/2020643
31/08/2020323
30/09/2020211
31/10/2020321
30/11/2020322
31/12/2020211
31/01/2021211
28/02/2021211
31/03/2021000
30/04/2021000
31/05/2021000
30/06/2021000
31/07/2021211
31/08/2021000
30/09/2021000
31/10/2021211
30/11/2021211
31/12/2021211
31/01/2022321
28/02/2022323
31/03/2022211
30/04/2022322
31/05/2022000
30/06/2022211
31/07/2022533
31/08/2022532
30/09/2022422
31/10/2022211
30/11/2022222
31/12/2022432
31/01/2023312
28/02/2023626
31/03/2023523
30/04/2023836
31/05/20231085
30/06/2023968
Download data as CSV
Information
Sector: 
Segment: 
Category: 
Gas liquidity (GSH)
AER reference: 
D11/2298801[V6]
Source: 
AEMO; AER
Overview: 

To supplement the voluntary gas supply hub located at Wallumbilla, the Moomba hub was established from 1 June 2016 to facilitate trade on the Moomba to Adelaide Pipeline (MAP) and Moomba to Sydney Pipeline (MSP). A spread product also allows for trading between the Wallumbilla and Moomba markets on the SWQP (representing the price differential between the two hubs at the MSP and WAL trading locations).

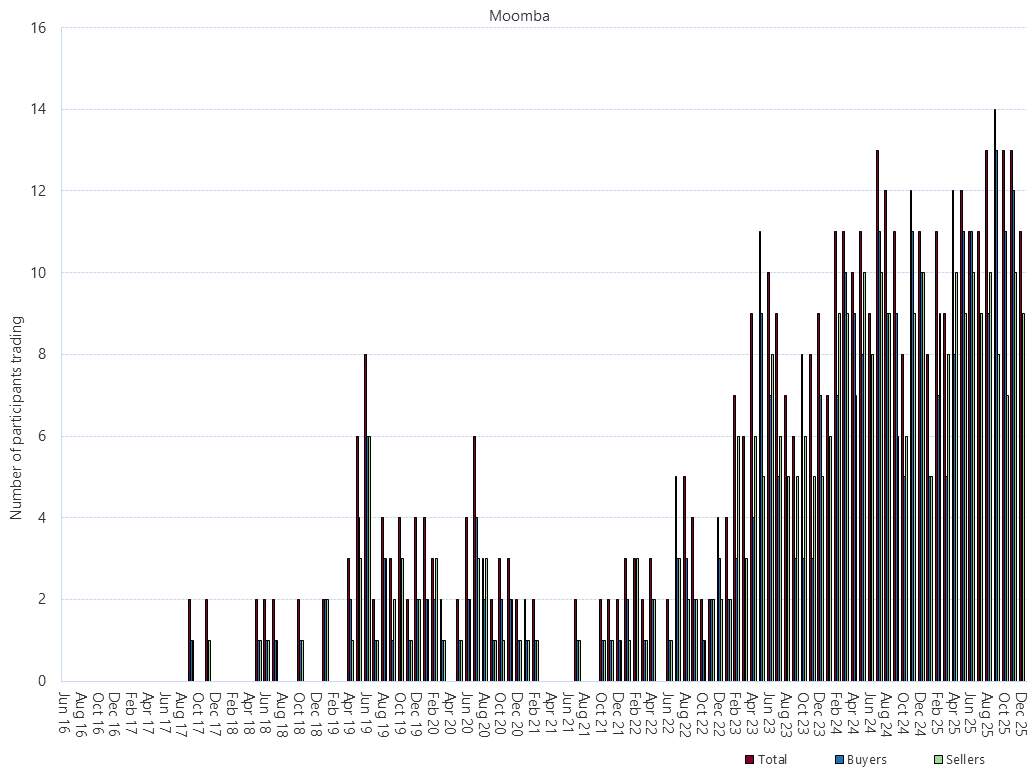
This figure is a summary of monthly trading activity in the gas supply hub by unique number of trading participants. The total number of participants trading indicates the number of unique participants who executed trades during the period. The number of buyers and sellers indicates the number of unique participants who executed trades as either the buyer or seller.

Note: Corrections have been made to include a small number of MOO Not-netted trades previously missing from the AER dataset.