Peak day demand by region

Tabs

Graph
Data
Financial YearQLD (Terajoules)NSW/ACT (Terajoules)VIC (Terajoules)SA (Terajoules)TAS (Terajoules)
2008/09367582124649065
2009/10380618116742558
2010/11431593114548388
2011/12435576110443865
2012/13437588120546565
2013/14438573112846660
2014/15438583121637733
2015/16425572119244987
2016/17394591120857581
2017/18498582129547199
2018/19366538127047470
2019/20368586129941157
2020/21414598128139867
2021/22361723117734467
2022/23359593121133365
Download data as CSV
Information
Sector: 
Segment: 
Category: 
Gas demand
AER reference: 
D11/2298801[V4]
Source: 
AER;AEMO
Overview: 

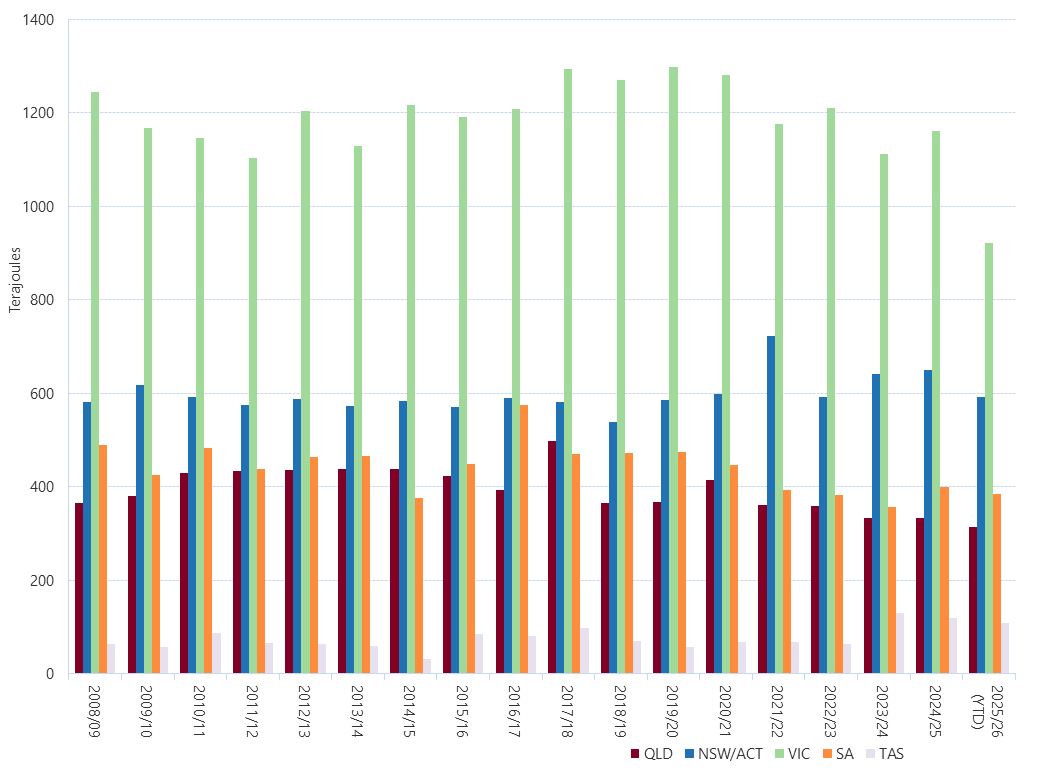
This figure shows daily regional Gas Bulletin Board peak daily demand by financial year (SA = MAP + SEAGAS, NSW/ACT = EGP + MSP, TAS = TGP, QLD = RBP + CGP + QGP, VIC = SWP + LMP adjusted for imports from Vic-NSW interconnector). YTD data is current at 1 July 2023.

NOTE: Bulletin Board data has been updated to include revised production quantities from October 2018. A template error in the Bulletin Board demand calculation for 2018/19 has been corrected. This affected the peak day demand calculation for Victoria.

Refer to the Average daily regional demand figure for notes on regional demand calculations.