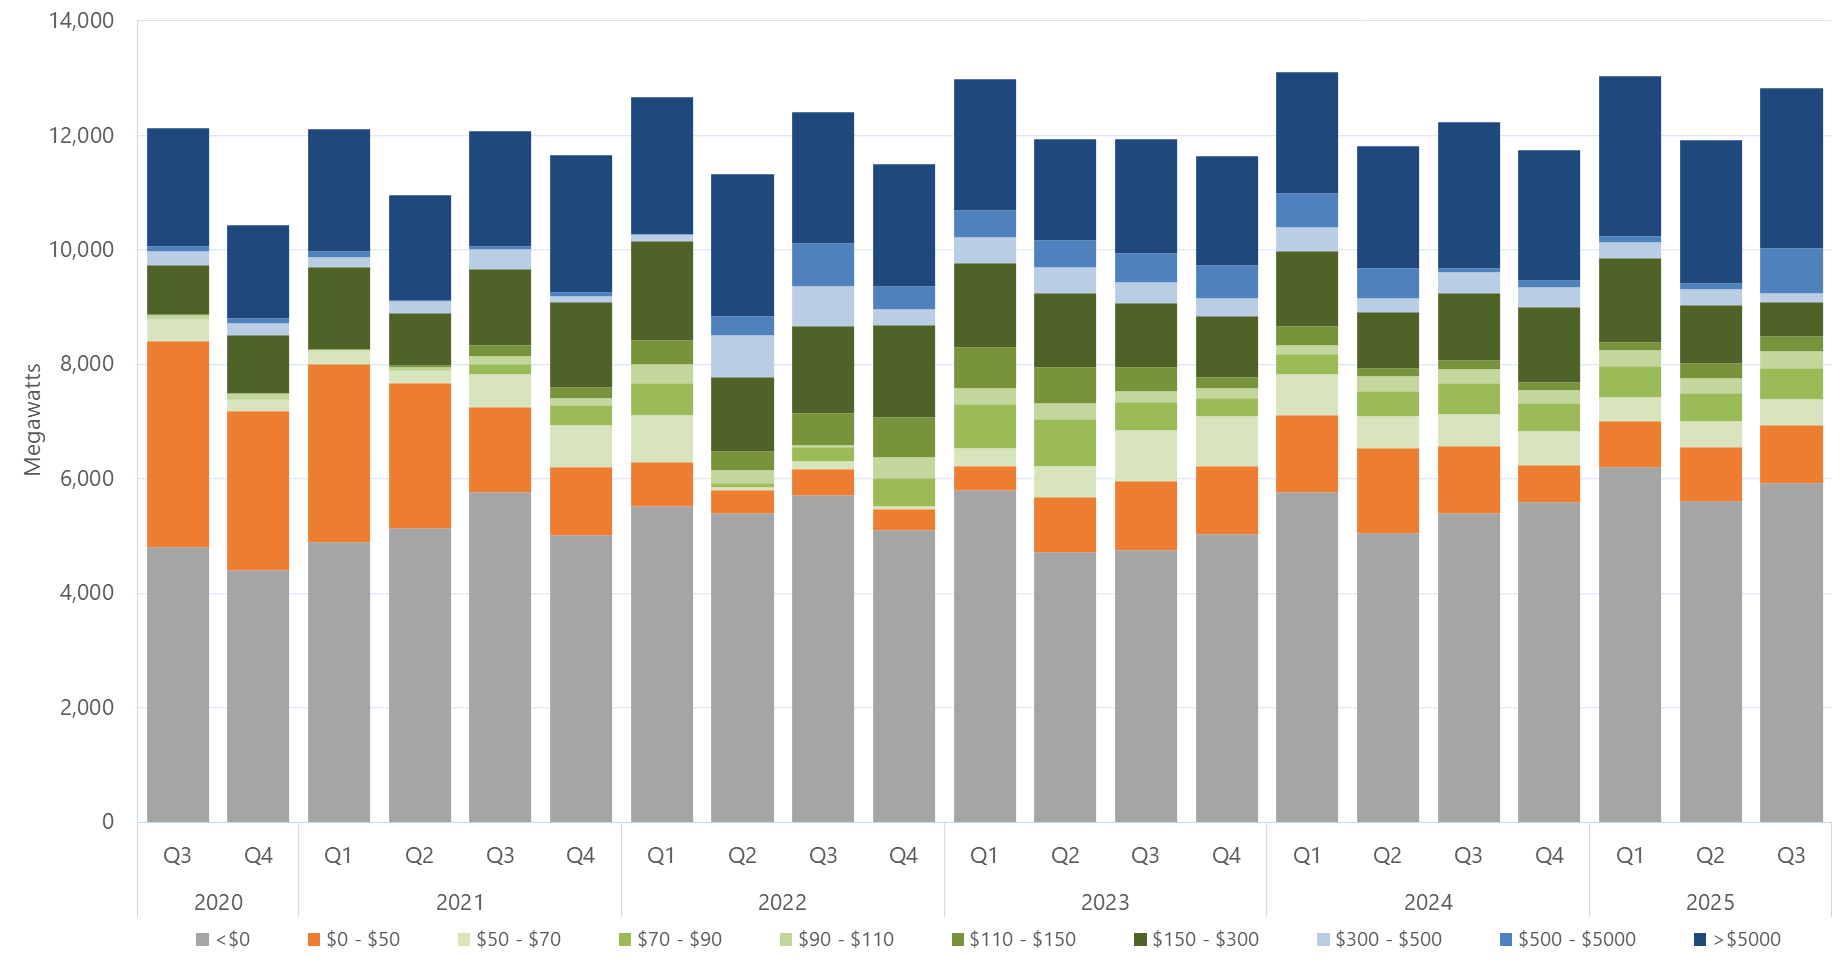
Quarterly average regional offers by price band - New South Wales

Tabs

Graph
Data
Quarter<$0 (Megawatts)$0 - $50 (Megawatts)$50 - $70 (Megawatts)$70 - $90 (Megawatts)$90 - $110 (Megawatts)$110 - $150 (Megawatts)$150 - $300 (Megawatts)$300 - $500 (Megawatts)$500 - $5000 (Megawatts)>$5000 (Megawatts)
2013 Q1427633741503769235737287134310909
2013 Q238683142194520416259928211608772
2013 Q3397528282229142143518236116630951
2013 Q44038294723472210817440136301098
2014 Q144043216190328285229356141801452
2014 Q2400736309962212418726714870975
2014 Q3366843533814612546141658901164
2014 Q434144564338223468151224301210
2015 Q1373249933280630158524201432
2015 Q236744549201293723166331211212
2015 Q338724913266113500159535611228
2015 Q437294519357681100136545801257
2016 Q13778472729836740136654801277
2016 Q23649351714862375124445901385
2016 Q341853779224591752116071701907
2016 Q437812959317361286114252702244
2017 Q14370250592563265304147732602438
2017 Q2425110161862343498358130837802070
2017 Q34140103811681156579435222170201597
2017 Q437011208223469616414484175201621
2018 Q144071689214827923582194171211714
2018 Q23996212214261681363043161041408
2018 Q3398818031827180118128879514161701
2018 Q44217178813202711046573151602308
2019 Q1444422741025320220367108643422404
2019 Q239302539108231825818279754501922
2019 Q34628257869517322826588536031916
2019 Q44378240373813130882129126191727
2020 Q14516338745291121151200276341640
2020 Q24673309239226308173761422365
2020 Q3481635923770842859258882050
2020 Q444032784200110321019210951617
2021 Q149033104241122014361761072119
2021 Q251492533223183729908205311823
2021 Q3576714955681801341921334337602006
2021 Q4502511807433451291881485101672390
2022 Q15522766832547348409172912902387
2022 Q25402411447122833212897313432469
2022 Q357264501442372955915187107482282
2022 Q451143674349735870416072704172132
2023 Q1581240632477126872614594524862275
2023 Q2472695253883027863312904584661757
Download data as CSV
Information
Sector: 
Segment: 
Category: 
Electricity market average offers
AER reference: 
11048184
Source: 
AER; AEMO
Overview: 

This figures shows the quarterly average amount of capacity offered within each price band by all generators in New South Wales for the past five years. The data tab contains data since 2013.

Q2 2022 offer data may not be a true reflection of the available capacity in the market due to administered pricing and market suspension.