Tabs Graph Download graph Data Quarter<$0 (Megawatts)$0 - $50 (Megawatts)$50 - $70 (Megawatts)$70 - $90 (Megawatts)$90 - $110 (Megawatts)$110 - $150 (Megawatts)$150 - $300 (Megawatts)$300 - $500 (Megawatts)$500 - $5000 (Megawatts)>$5000 (Megawatts) 2013 Q125383557310104451012805586311495 2013 Q2205534766012753412632310501411734 2013 Q318713420630134110652109222521697 2013 Q419133672648151181964783062712165 2014 Q1256336857295845303804501432280 2014 Q2296730325145487185842731211701 2014 Q3455922951289312668988661292 2014 Q4519519194624533516151411602 2015 Q1533316114762020520861721931 2015 Q2489921139722170487662141614 2015 Q346221918124621125275061551418 2015 Q449441962228942174544651541432 2016 Q15452137459423453705822272248 2016 Q249461706701071591894562281781 2016 Q3507315361701177273765812091492 2016 Q4511513213281302384235432721592 2017 Q15840111029131170422592444962165 2017 Q25274926283183205514675902731785 2017 Q35277920517181105333094332461366 2017 Q451261180634196149524105824701312 2018 Q158029535462941602294105004131552 2018 Q25499923730276911732724383391329 2018 Q35085109459521971166270818611473 2018 Q4502611276951867384311198871329 2019 Q15878801464303351330232668141633 2019 Q25329771823260102183207157981337 2019 Q354999437051103410152071022862 2019 Q45628114439713558842532212561260 2020 Q15926147640212462953481311461279 2020 Q253431901153171781298212931453 2020 Q35291180812831771250411871140 2020 Q45683142619858642574912281108 Download data as CSV Information Sector: ElectricitySegment: WholesaleCategory: Electricity market average offersAER reference: 11048184Source: AER; AEMOOverview: 
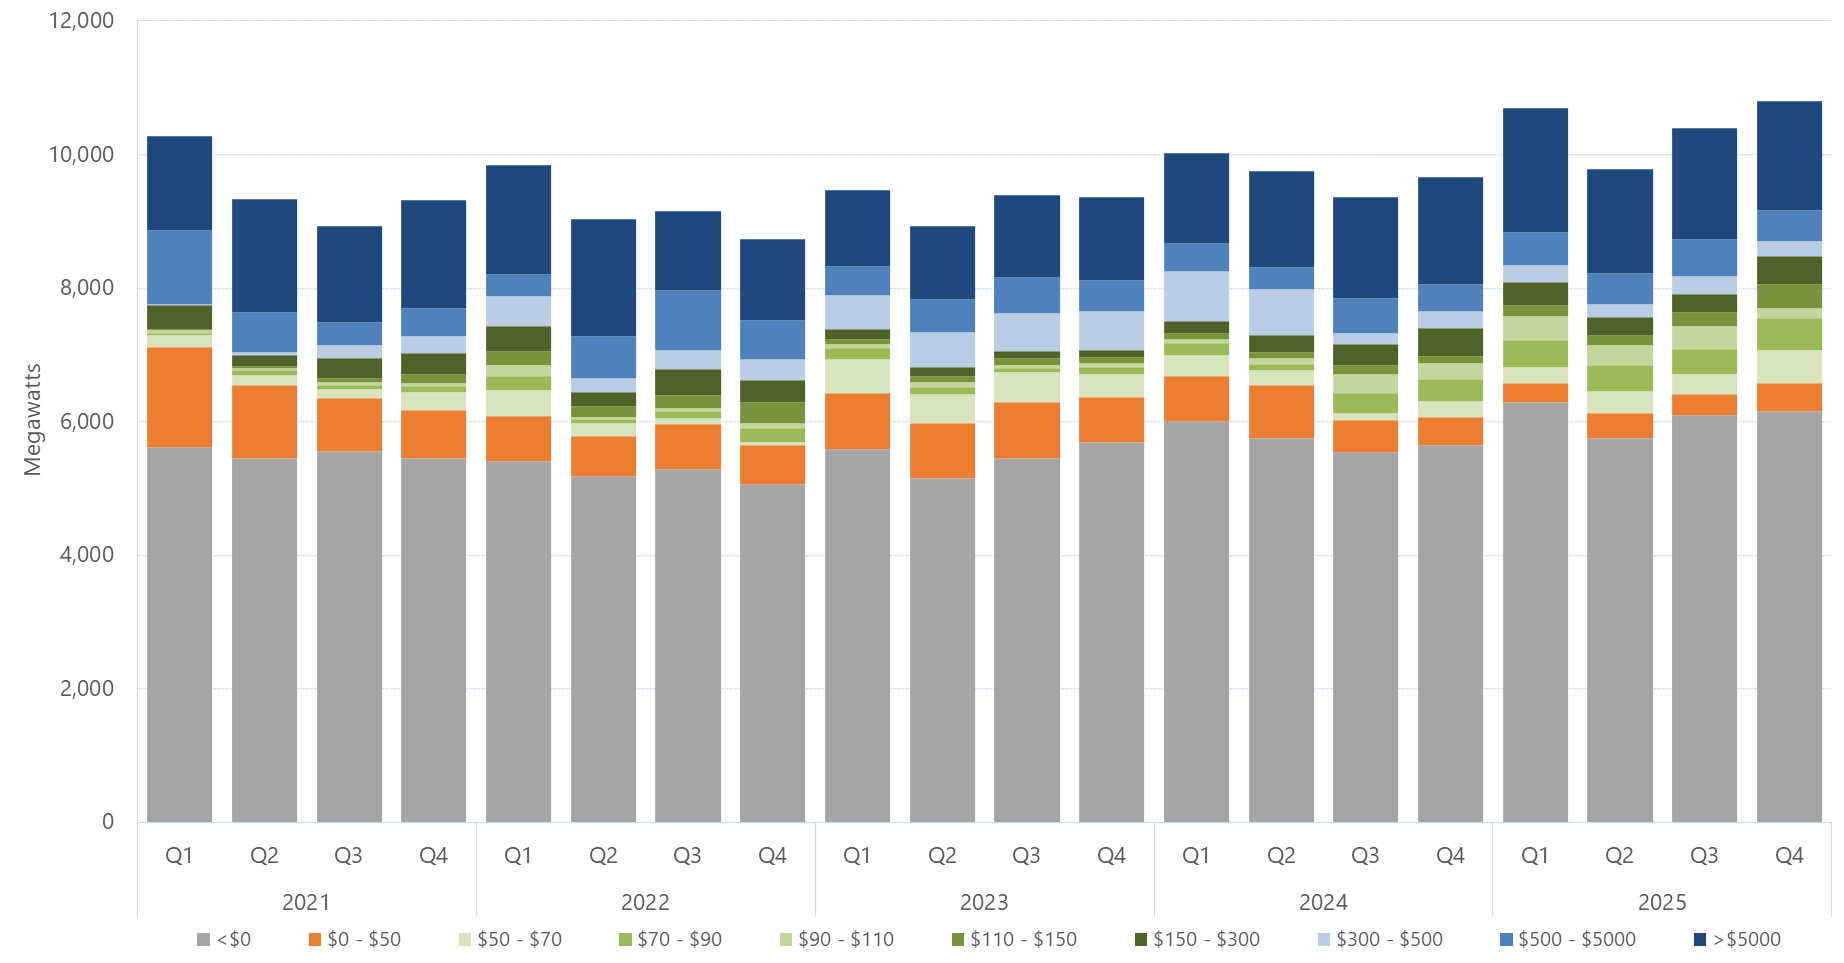
This figures shows the quarterly average amount of capacity offered within each price band by all generators in Queensland for the past five years. The data tab contains data since 2013. Download:Download graphDownload data as CSV