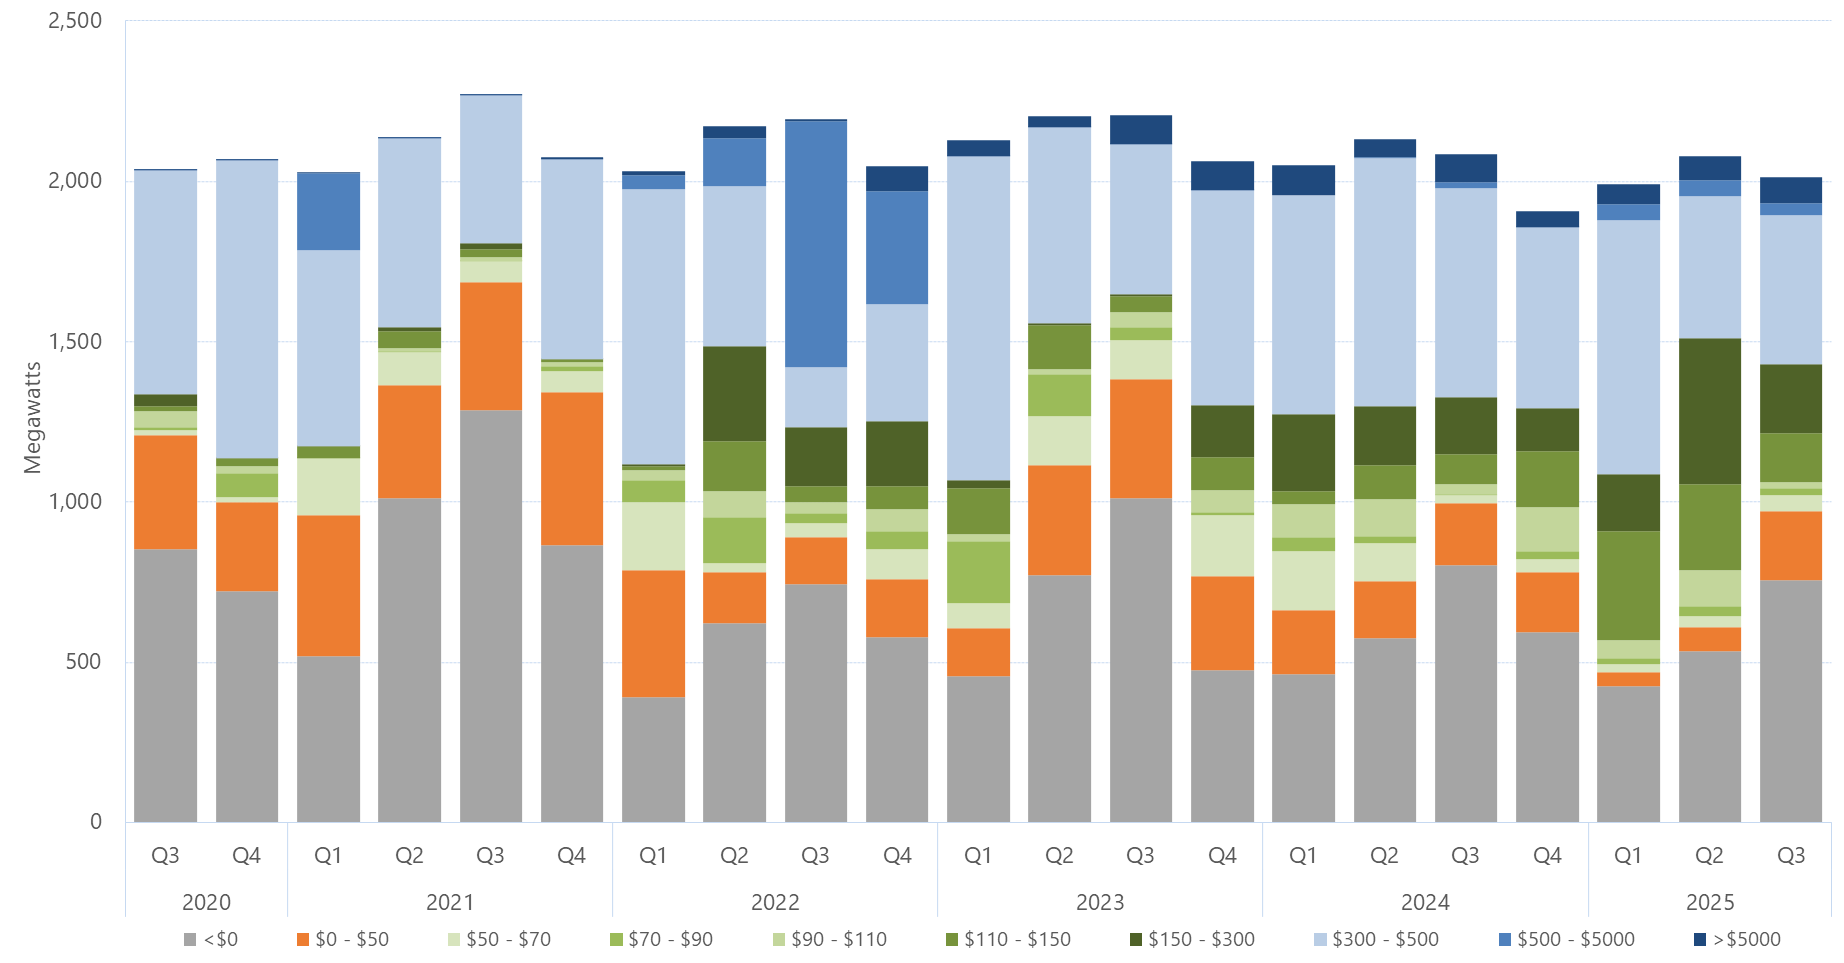
Tabs Graph Download graph Data Quarter<$0 (Megawatts)$0 - $50 (Megawatts)$50 - $70 (Megawatts)$70 - $90 (Megawatts)$90 - $110 (Megawatts)$110 - $150 (Megawatts)$150 - $300 (Megawatts)$300 - $500 (Megawatts)$500 - $5000 (Megawatts)>$5000 (Megawatts) 2013 Q1480832380572118307003 2013 Q26928806715590166004 2013 Q31015768600301096000 2013 Q484584217056500721 2014 Q19064932923714864436270 2014 Q210756564133382540310 2014 Q375371799453100003 2014 Q4423501508884500000 2015 Q145660785135716014002 2015 Q278970801014360420015 2015 Q38936284155300004 2015 Q4349661333433476631342604 2016 Q163400871399411663006 2016 Q2699367165392553981232333 2016 Q31197119113667440719909 2016 Q410211171611421514258437025 2017 Q148421730619612160961018 2017 Q26724811816884140226704032 2017 Q39978880191100312342100 2017 Q4833321361622061921745045 2018 Q1604491323051463414849073 2018 Q2774754362536479292123019 2018 Q31356445139421022981101 2018 Q46322662693491935345701 2019 Q159097121313583034692691 2019 Q287512421383031778843000 2019 Q3988249131832725361156610 2019 Q46662353096145337571301 2020 Q1568483612514723289665 2020 Q21055397400162054600 2020 Q3855355151051163669602 2020 Q472027715762124092811 Download data as CSV Information Sector: ElectricitySegment: WholesaleCategory: Electricity market average offersAER reference: 11048184Source: AER; AEMOOverview: This figures shows the quarterly average amount of capacity offered within each price band by all generators in Tasmania for the past five years. The data tab contains data since 2013. Download:Download graphDownload data as CSV