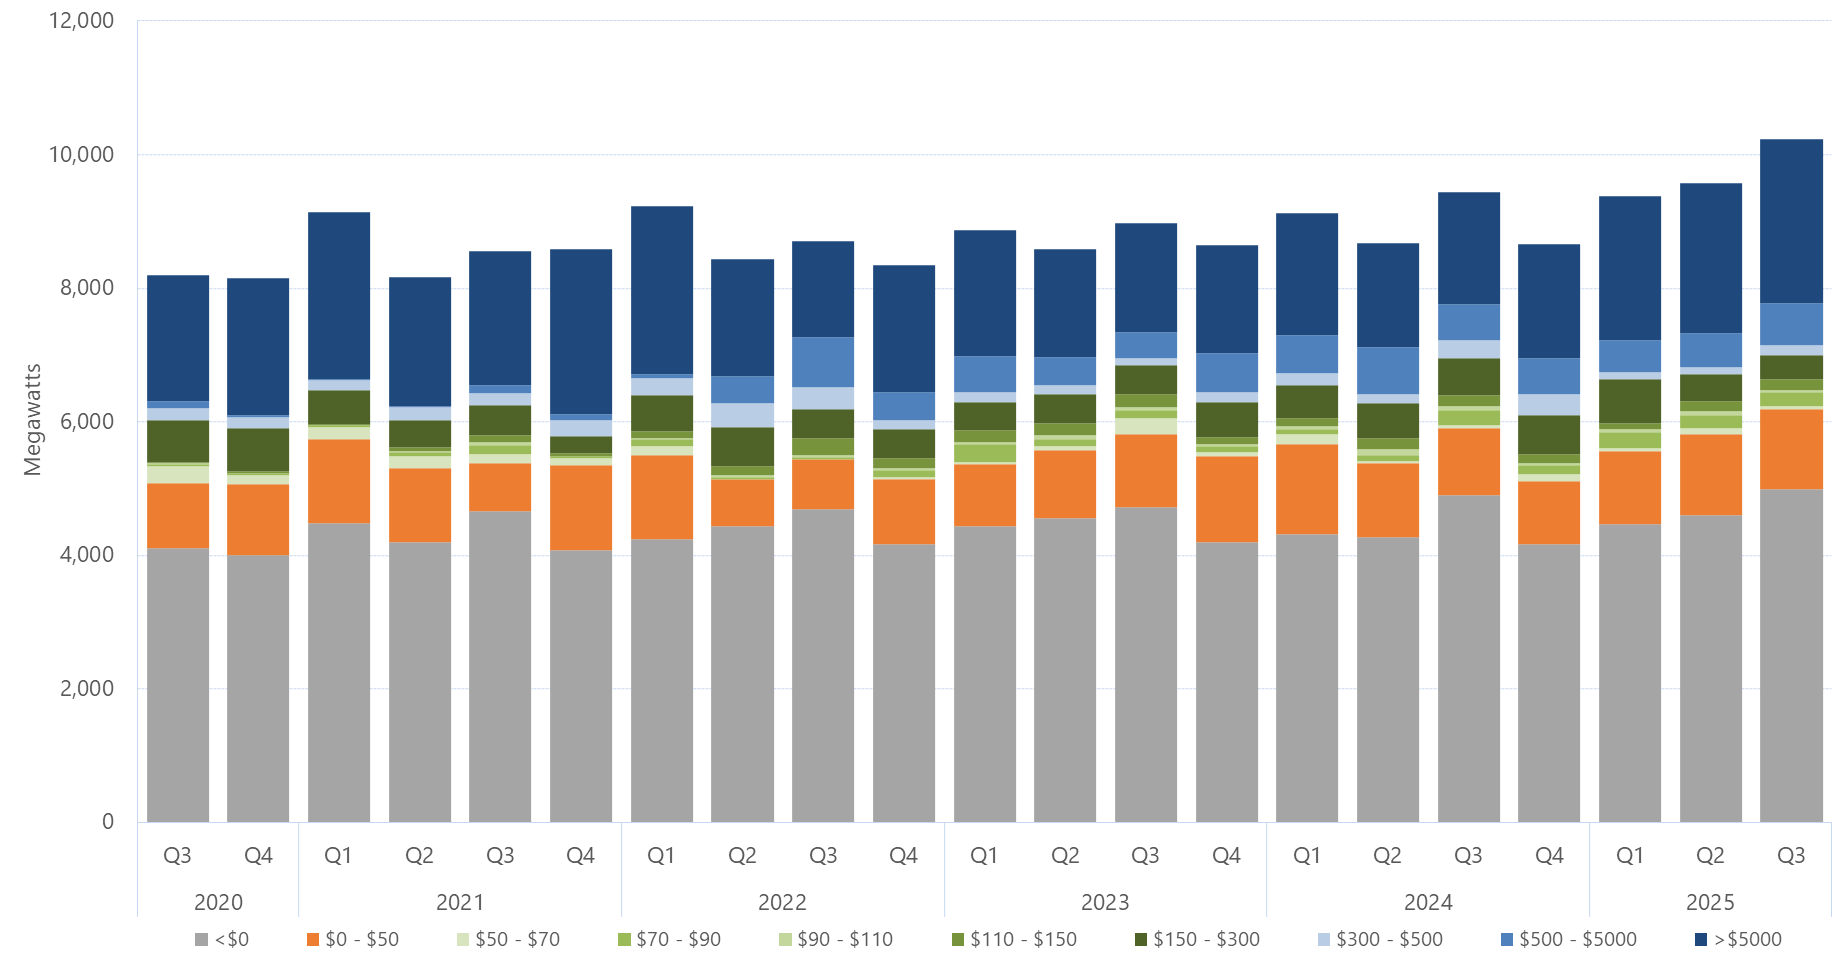
Tabs Graph Download graph Data Quarter<$0 (Megawatts)$0 - $50 (Megawatts)$50 - $70 (Megawatts)$70 - $90 (Megawatts)$90 - $110 (Megawatts)$110 - $150 (Megawatts)$150 - $300 (Megawatts)$300 - $500 (Megawatts)$500 - $5000 (Megawatts)>$5000 (Megawatts) 2013 Q14336212541942923184982764231571 2013 Q2418018944372251572291754233781246 2013 Q340061798410662883631134321231546 2013 Q43985195467031792146834721675 2014 Q14391183339831005057651341853 2014 Q242011788468723239471296311587 2014 Q3418021443941341458195538131863 2014 Q4420122203401371171254957901814 2015 Q1436822911398789119282432004 2015 Q24325213726149392110153532251 2015 Q34228208116183225052627512085 2015 Q4404618662746119572727571989 2016 Q14290192116765159152227802197 2016 Q24370165911918921463727702092 2016 Q34442175310154644059026332030 2016 Q44337194597824215235502199 2017 Q1418216788312831118618166142409 2017 Q2308917445029529614265310541788 2017 Q332621573872351901549476051719 2017 Q43036136613828518510583131871831 2018 Q132921529751943862150819642186 2018 Q2345915052413561593259317831510 2018 Q33649131512326722473529137102081 2018 Q43410100214825711778825651977 2019 Q13920996239221912484917922139 2019 Q2363590160164307134972108231547 2019 Q341065097115221281790369171305 2019 Q44151447594711525572484321645 2020 Q1410098214111814318815200181880 Download data as CSV Information Sector: ElectricitySegment: WholesaleCategory: Electricity market average offersAER reference: 11048184Source: AER; AEMOOverview: This figures shows the quarterly average amount of capacity offered within each price band by all generators in Victoria for the past five years. The data tab contains data since 2013. Download:Download graphDownload data as CSV