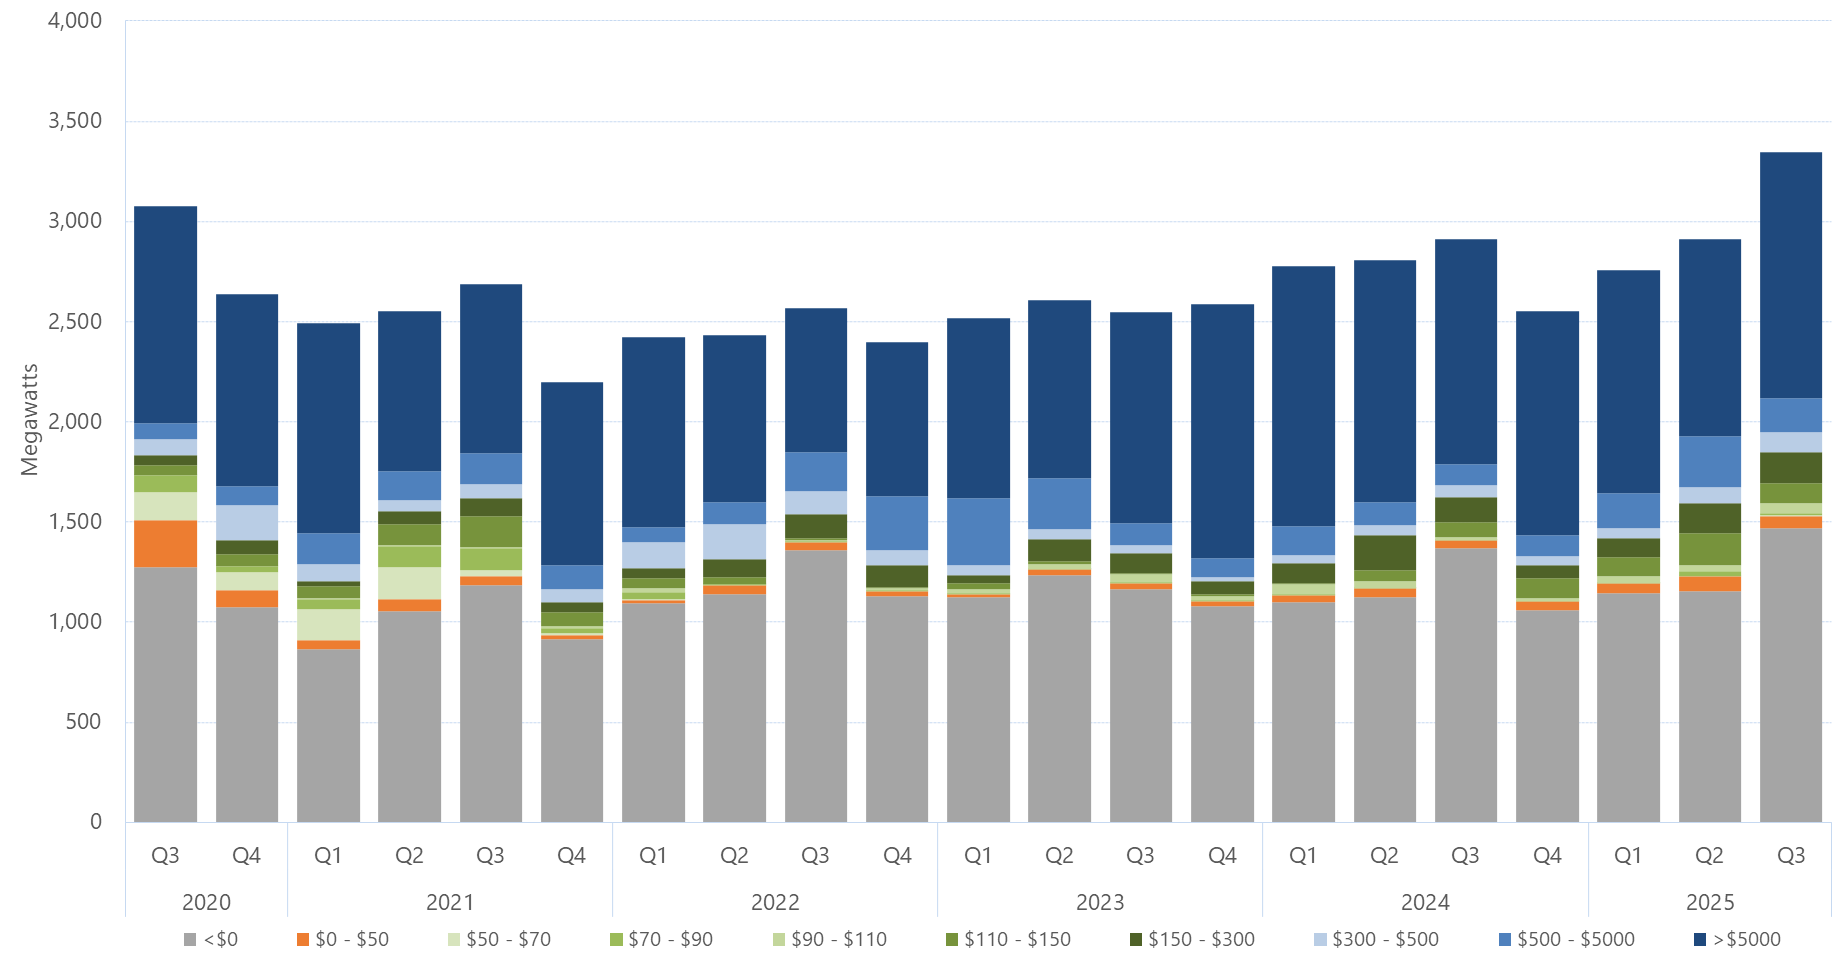
Tabs Graph Download graph Data Quarter<$0 (Megawatts)$0 - $50 (Megawatts)$50 - $70 (Megawatts)$70 - $90 (Megawatts)$90 - $110 (Megawatts)$110 - $150 (Megawatts)$150 - $300 (Megawatts)$300 - $500 (Megawatts)$500 - $5000 (Megawatts)>$5000 (Megawatts) 2013 Q111982818432841137367110515 2013 Q28411326043110292351213578 2013 Q39467886177142228307558 2013 Q4100815113115979027605525 2014 Q1113918716520510601881647548 2014 Q21063143184171230157047502 2014 Q3108832714641150643351621 2014 Q41049402960165292978542 2015 Q111223182370210743045582 2015 Q2998238223038264656639 2015 Q3100013525219526704363608 2015 Q4115410621905462323865696 2016 Q11160281338419874613671699 2016 Q2102620927736985116064726 2016 Q396636395128857125121775 2016 Q4799610311725024166114690 2017 Q1893123128011032226131719 2017 Q291012312838128151181133611 2017 Q3127216715812944101115109685 2017 Q41124117113568425385105748 2018 Q11117161131714436115115989 2018 Q299075611366632187132812 2018 Q3127322116052173784139859 2018 Q410571613561774921078746 2019 Q111762915673925926491833 2019 Q212051101531721482618284774 2019 Q3131594321976891718591890 2019 Q41167158411029743513479904 2020 Q11009791974514258196831052 2020 Q2111123884471584181801132 2020 Q31273237136861505279771087 2020 Q410748790310576917695959 2021 Q1864481535306227851551045 2021 Q210545916010651036954142801 2021 Q31184443110961549270153846 2021 Q491619112510714568117917 2022 Q110931763319544712978946 Download data as CSV Information Sector: ElectricitySegment: WholesaleCategory: Electricity market average offersAER reference: 11048184Source: AER; AEMOOverview: This figures shows the quarterly average amount of capacity offered within each price band by all generators in South Australia for the past five years. The data tab contains data since 2013. Download:Download graphDownload data as CSV