Quarterly base futures prices and volume traded

Tabs

Graph
Data
QuarterQueensland price ($ per megawatt hour)New South Wales price ($ per megawatt hour)Victoria price ($ per megawatt hour)South Australia price ($ per megawatt hour)Queensland volume ($ per megawatt hour)New South Wales volume ($ per megawatt hour)Victoria volume ($ per megawatt hour)South Australia volume ($ per megawatt hour)
2022 Q4120.5116.163.566.0401.0308.0405.02.0
2023 Q1162.2143.083.0120.010873.07451.06018.040.0
2023 Q2126.6142.0113.0130.610266.07078.06295.034.0
2023 Q3107.6137.5110.3124.511116.08098.06328.036.0
2023 Q489.187.550.080.011106.08135.06128.035.0
2024 Q1116.0108.074.1138.02106.01894.01230.024.0
2024 Q287.5109.073.8131.62219.01679.01394.03.0
2024 Q386.5110.474.4130.01245.0647.0789.00.0
2024 Q482.390.049.972.51196.0634.0832.02.0
2025 Q1107.5105.465.0119.0819.0134.0237.010.0
2025 Q284.0104.971.9130.0781.0137.0190.00.0
2025 Q382.5111.471.9125.0594.079.083.00.0
2025 Q479.886.448.185.0592.0127.0142.00.0
2026 Q1105.998.062.7134.330.032.00.00.0
2026 Q286.9120.675.6145.327.010.00.00.0
2026 Q382.5125.078.0150.00.01.00.00.0
Download data as CSV
Information
Sector: 
Segment: 
Category: 
Electricity contract prices
AER reference: 
11048184
Source: 
AER; ASX Energy
Overview: 

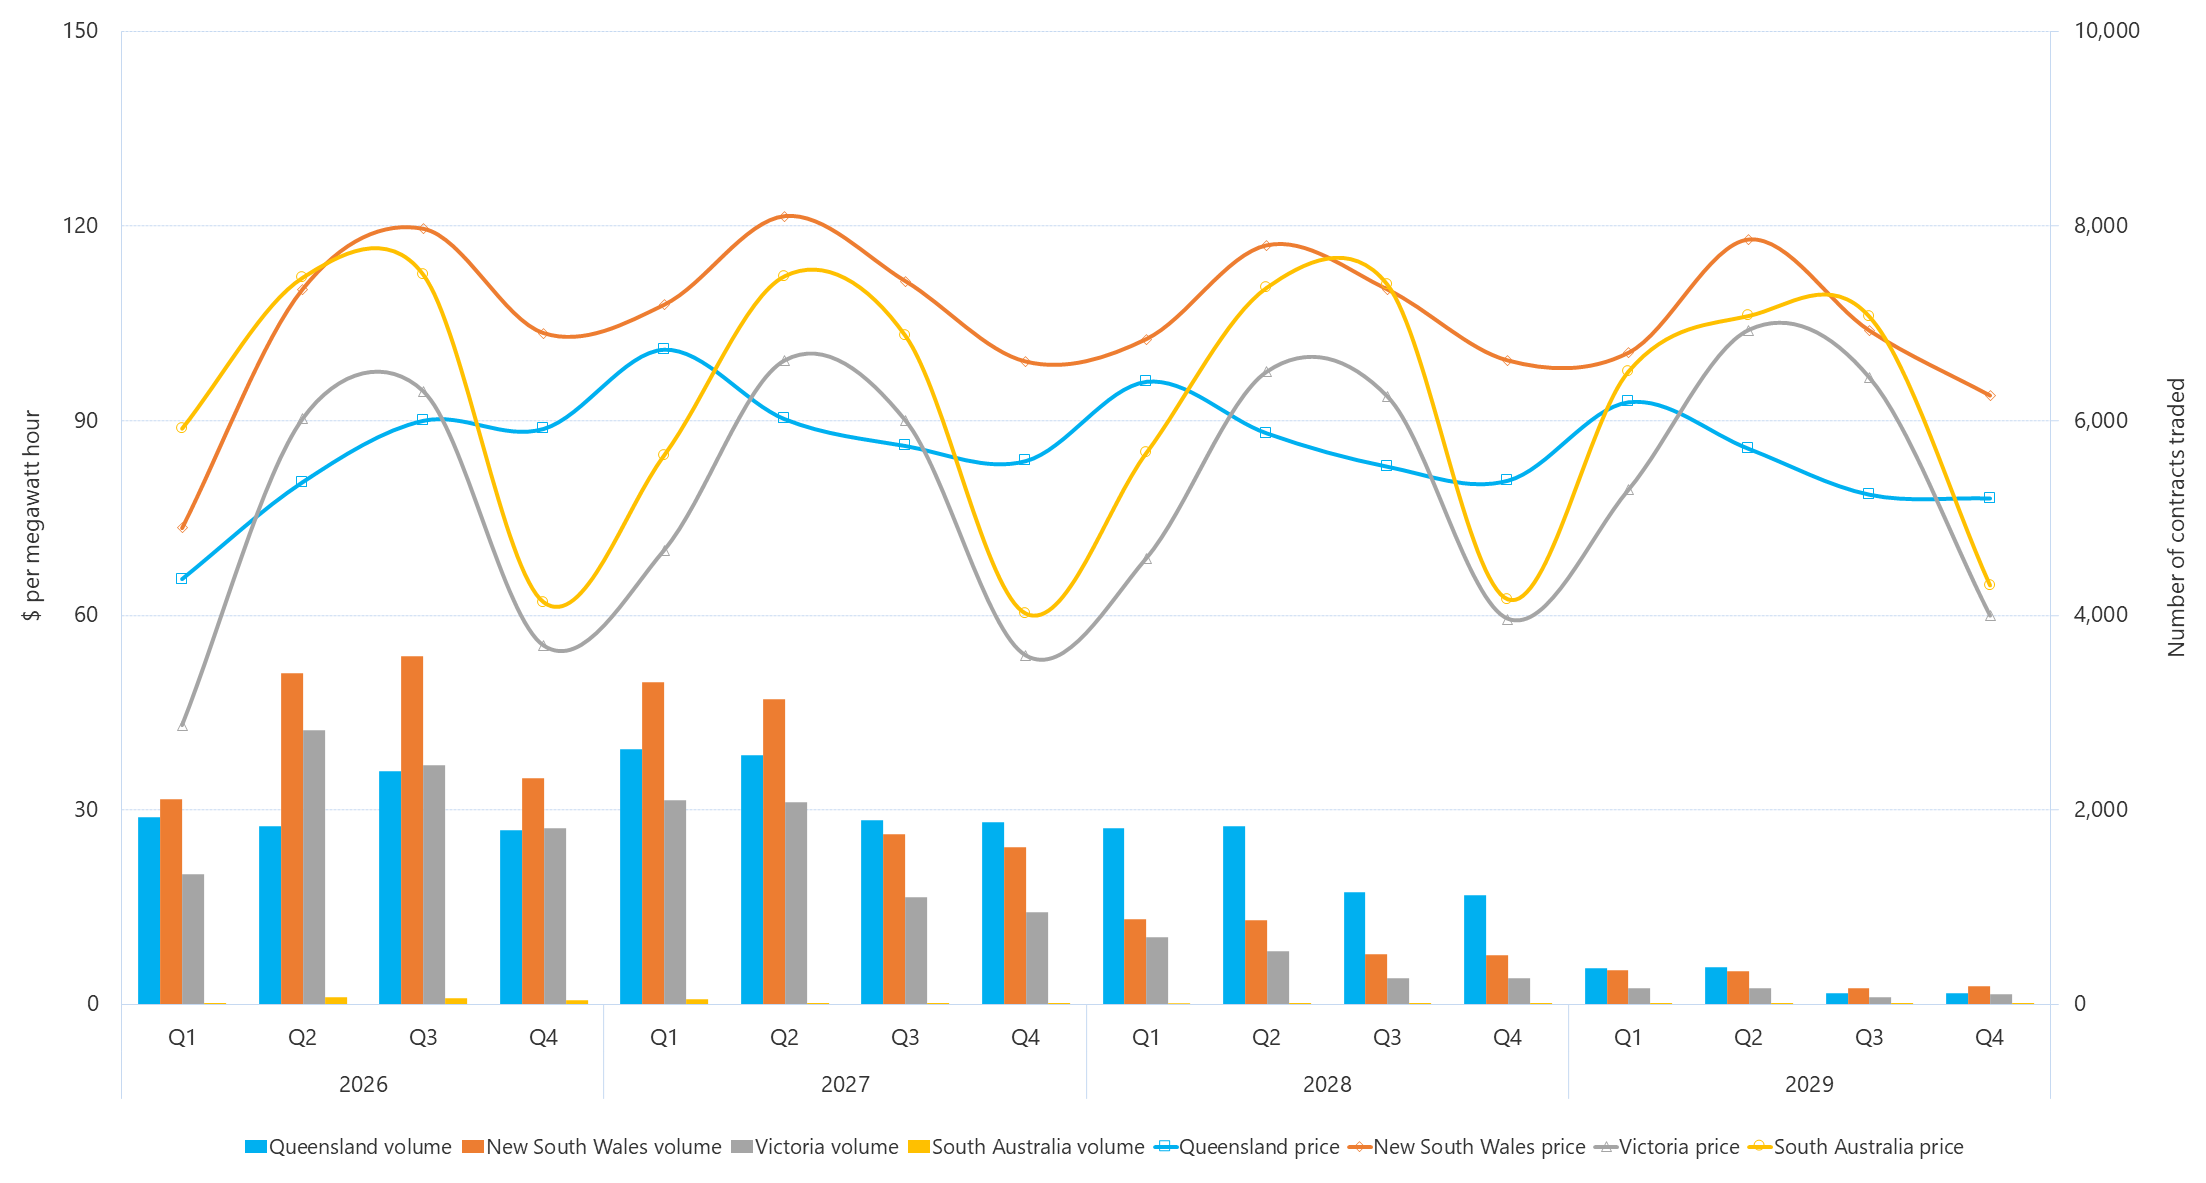
This figure shows the prices for base contracts (settled price on 31 December 2022) for each quarter for the next four calendar years as well as the volume of each base contract traded in the most recent quarter.