Quarterly count of 30-minute prices above $5000/MWh

Tabs

Graph
Data
QuarterQueensland (Number of trading intervals)New South Wales (Number of trading intervals)Victoria (Number of trading intervals)South Australia (Number of trading intervals)Tasmania (Number of trading intervals)
2001 Q30000
2001 Q40000
2002 Q10000
2002 Q23500
2002 Q33000
2002 Q42000
2003 Q10100
2003 Q22420
2003 Q32200
2003 Q41000
2004 Q15501
2004 Q20000
2004 Q30000
2004 Q40803
2005 Q11201
2005 Q20000
2005 Q300002
2005 Q4314002
2006 Q166510
2006 Q200001
2006 Q301000
2006 Q400000
2007 Q131620
2007 Q21217000
2007 Q300000
2007 Q421010
2008 Q11602510
2008 Q200000
2008 Q311110
2008 Q417000
2009 Q10112273
2009 Q2000013
2009 Q300000
2009 Q45190230
2010 Q14210240
2010 Q200701
2010 Q302005
2010 Q400001
2011 Q1812390
2011 Q200000
2011 Q300000
2011 Q401000
2012 Q100000
2012 Q200000
2012 Q300000
2012 Q400300
2013 Q110000
2013 Q200000
2013 Q300000
2013 Q401020
2014 Q100110
2014 Q200000
2014 Q300000
2014 Q470000
2015 Q190000
2015 Q200000
2015 Q302000
2015 Q400000
2016 Q101210
2016 Q200000
2016 Q300030
2016 Q401040
2017 Q1146080
2017 Q200000
2017 Q300000
2017 Q400000
2018 Q100690
2018 Q200000
2018 Q300010
2018 Q400000
2019 Q10016150
2019 Q200000
2019 Q300000
2019 Q400120
2020 Q10111150
2020 Q200000
2020 Q300000
2020 Q405000
2021 Q100070
2021 Q288330
2021 Q321000
2021 Q470040
2022 Q1120121
2022 Q21562118
2022 Q3600100
2022 Q400014
2023 Q153040
2023 Q265050
Download data as CSV
Information
Sector: 
Segment: 
Category: 
Electricity spot prices
AER reference: 
11048184
Source: 
AER; AEMO
Overview: 

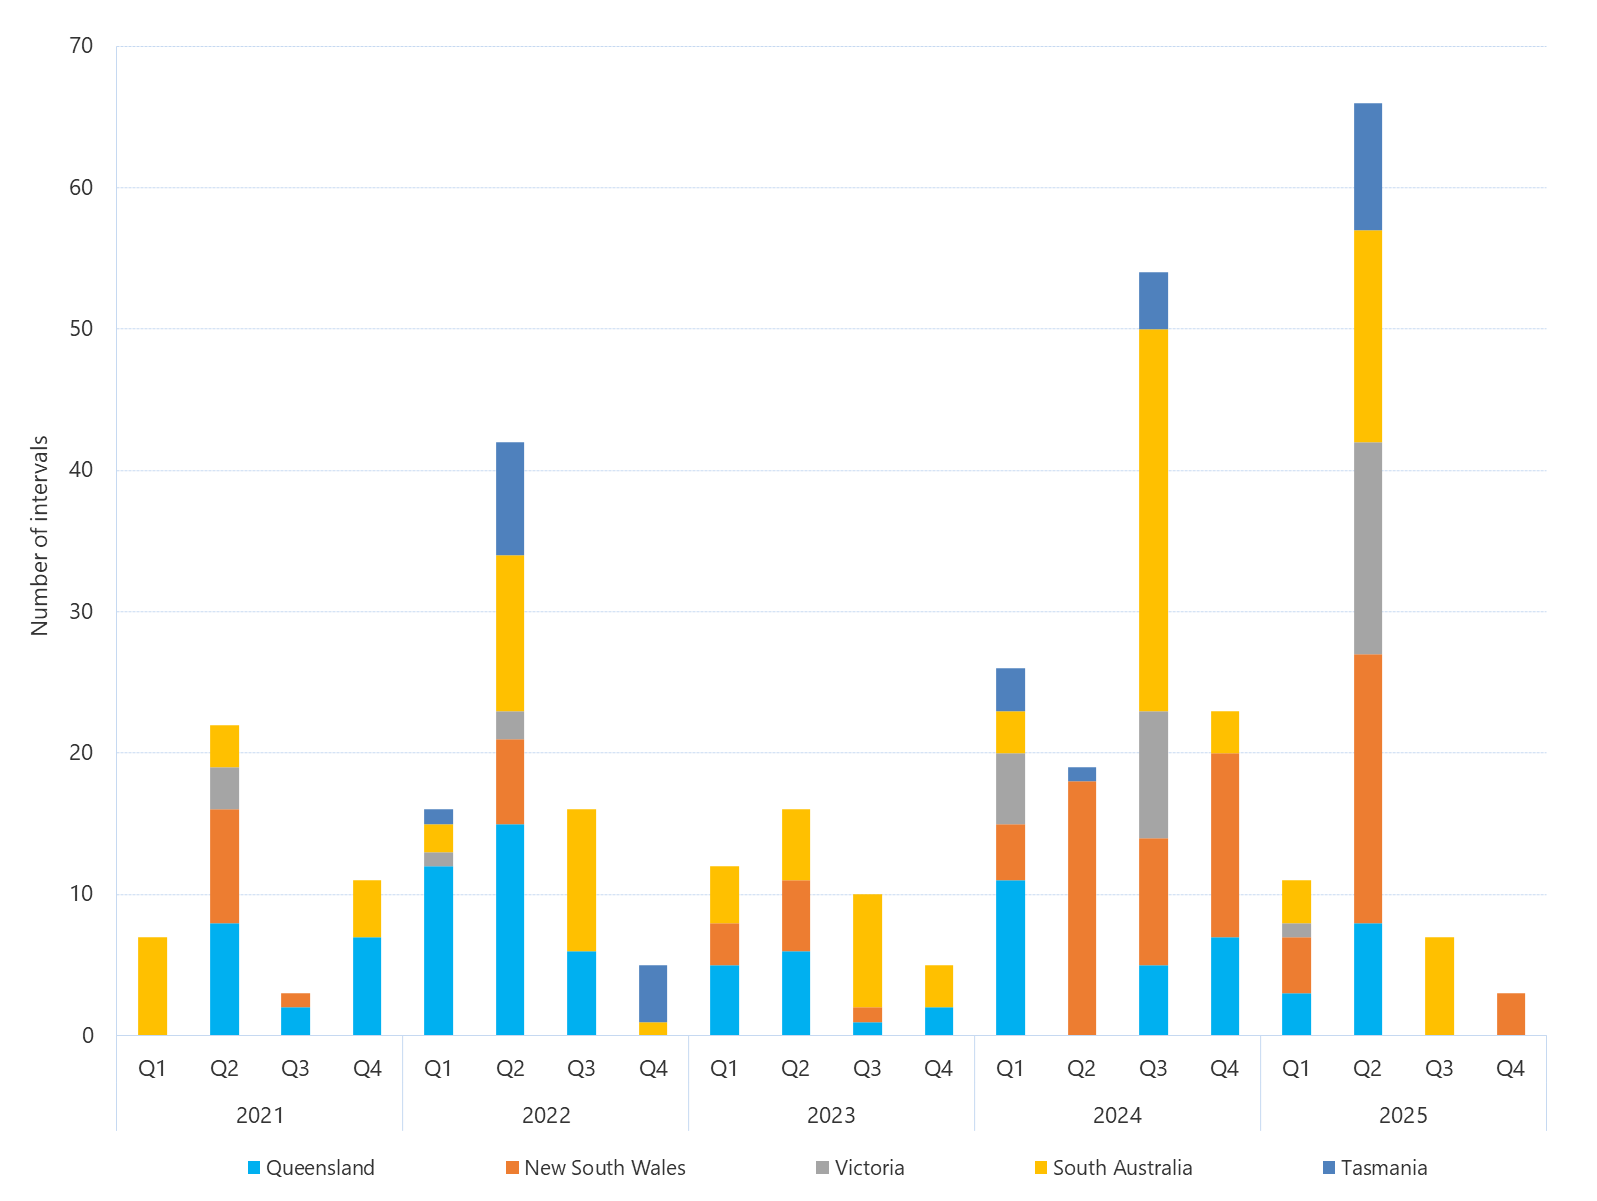
This figure shows the quarterly number of trading intervals where the 30-minute price for electricity has exceeded $5,000/MWh for the past five years. The data table contains more data points since 2001/02. Under the Electricity Rules, the AER is required to publish a report whenever the 30-minute price exceeds $5,000/MWh.