Tabs Graph Download graph Data QuarterQueensland (Number of trading intervals)New South Wales (Number of trading intervals)Victoria (Number of trading intervals)South Australia (Number of trading intervals)Tasmania (Number of trading intervals) 2001 Q30000 2001 Q40000 2002 Q10010 2002 Q20000 2002 Q30000 2002 Q40023 2003 Q11001 2003 Q20000 2003 Q30000 2003 Q40000 2004 Q10001 2004 Q21010 2004 Q30010 2004 Q40020 2005 Q10000 2005 Q21000 2005 Q310100 2005 Q410000 2006 Q110000 2006 Q230000 2006 Q300010 2006 Q400000 2007 Q1104228 2007 Q2102635 2007 Q3000224 2007 Q41001047 2008 Q130103 2008 Q210022 2008 Q31003212 2008 Q4101172 2009 Q122221446 2009 Q20001221 2009 Q33333140 2009 Q40053672 2010 Q14401736 2010 Q261022 2010 Q3923568 2010 Q410086423 2011 Q112033418 2011 Q2220235 2011 Q300547118 2011 Q4107185 2012 Q1160190 2012 Q2001460 2012 Q3251031 2012 Q4200140 2013 Q1400213 2013 Q210123 2013 Q300045 2013 Q400198 2014 Q1105395 2014 Q210021 2014 Q3701228 2014 Q4706526 2015 Q10081922 2015 Q211136157 2015 Q30024318 2015 Q41151062 2016 Q1006181 2016 Q2005912119 2016 Q3003390144 2016 Q41079163262 2017 Q1006277 2017 Q2100183 2017 Q34006117 2017 Q4801329 2018 Q12032937 2018 Q21041723 2018 Q35040139290 2018 Q480103019 2019 Q12082349 2019 Q29088312 2019 Q315754635995 2019 Q48006132655 2020 Q11205629389 2020 Q214222154209177 2020 Q3349812944539 2020 Q41466430766190 2021 Q113243871961 2021 Q223428284354290 2021 Q34231979431081855 2021 Q435219610391246639 2022 Q1313056072453 2022 Q242420338059 2022 Q331813158174322 2022 Q438733712231480202 Download data as CSV Information Sector: ElectricitySegment: WholesaleCategory: Electricity spot pricesAER reference: 11048184Source: AER; AEMOOverview: 
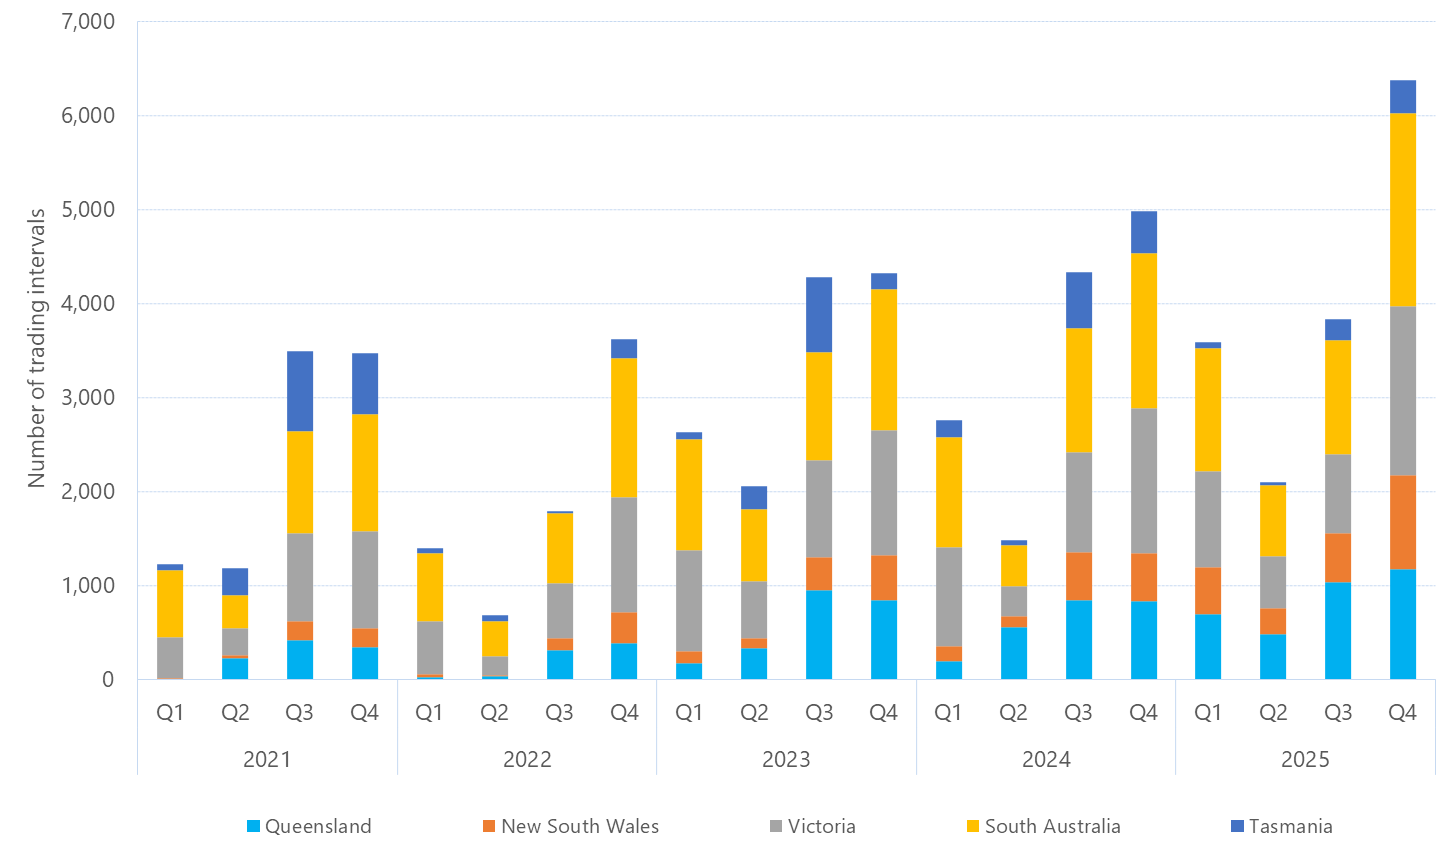
This figure shows the quarterly number of 30-minute intervals where the spot price for electricity was below $0/MWh for the past five years. The data table contains more data points since 2001/02. Download:Download graphDownload data as CSV