Tabs Graph Download graph Data Week endingBASE (Number of contracts)PEAK (Number of contracts)CAPS (Number of contracts) 2014 Q33495426277386 2014 Q44299321217200 2015 Q12803913514889 2015 Q22850110663736 2015 Q32670611874701 2015 Q42772617464908 2016 Q1234388627522 2016 Q23059311285245 2016 Q3229659765201 2016 Q4316925556098 2017 Q13097713526524 2017 Q2231405845000 2017 Q3229664483858 2017 Q42054012934563 2018 Q11756311777873 2018 Q2335384986751 2018 Q32843612476525 2018 Q43790811589310 2019 Q1266448136153 2019 Q2314588614339 2019 Q34346110035795 2019 Q4451305805825 2020 Q1468352026689 2020 Q2485766034669 2020 Q3368384433575 2020 Q4495461495044 Download data as CSV Information Sector: ElectricitySegment: WholesaleCategory: Electricity contract pricesAER reference: 11048184Source: AER; ASX EnergyOverview: 
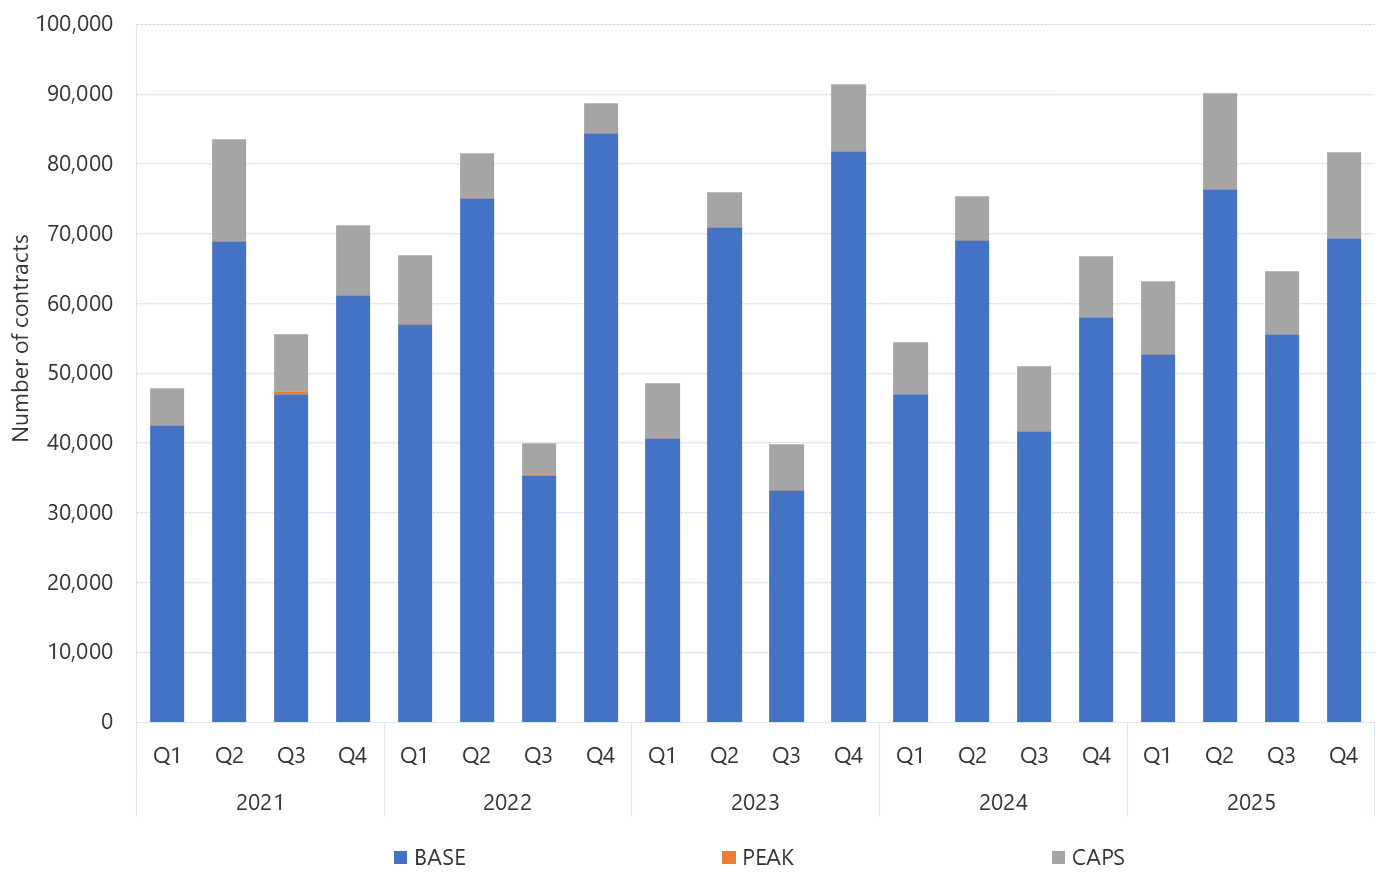
This figure shows the quarterly trading volumes for base, peak and cap contracts on ASX Energy for the past five years. Download:Download graphDownload data as CSV