Quarterly interregional trade as a percentage of regional energy consumption

Tabs

Graph
Data
Quarter endingQueensland (Percent Imports (-) or Exports (+))New South Wales (Percent Imports (-) or Exports (+))Victoria (Percent Imports (-) or Exports (+))South Australia (Percent Imports (-) or Exports (+))Tasmania (Percent Imports (-) or Exports (+))
2009 Q38.8-9.54.6-4.313.7
2009 Q49.2-10.411.9-3.2-22.4
2010 Q19.4-9.911.8-2.6-28.4
2010 Q215.7-9.12.6-6.9-7.5
2010 Q317.3-13.53.5-4.312.7
2010 Q414.3-20.016.6-5.86.7
2011 Q18.8-11.610.01.0-3.8
2011 Q210.4-6.33.8-6.5-7.6
2011 Q310.4-7.94.8-13.07.8
2011 Q47.5-12.516.5-9.8-13.4
2012 Q110.4-12.112.2-7.0-15.2
2012 Q213.8-11.73.6-2.38.6
2012 Q39.4-8.90.8-10.229.8
2012 Q49.7-11.54.20.59.9
2013 Q12.3-7.37.3-6.616.8
2013 Q23.9-6.88.4-23.720.6
2013 Q32.9-5.74.3-16.828.7
2013 Q41.3-7.76.8-10.730.9
2014 Q14.9-9.16.2-9.125.2
2014 Q26.2-10.75.6-12.634.5
2014 Q315.7-15.811.2-10.24.2
2014 Q411.8-17.423.2-10.0-29.8
2015 Q15.7-12.823.4-9.7-31.9
2015 Q211.7-15.016.1-17.9-1.5
2015 Q37.2-9.411.5-19.46.0
2015 Q46.6-8.516.0-8.9-33.0
2016 Q10.9-7.916.6-14.60.0
2016 Q25.3-11.315.1-13.92.9
2016 Q36.5-10.412.9-20.311.5
2016 Q44.3-14.224.6-25.65.3
2017 Q14.4-9.022.8-22.6-23.5
2017 Q210.7-7.26.7-15.3-10.2
2017 Q313.0-11.4-1.012.19.1
2017 Q48.8-7.5-2.314.71.4
2018 Q17.1-3.61.0-4.4-9.4
2018 Q211.7-10.24.8-9.85.4
2018 Q39.7-11.5-0.45.429.0
2018 Q45.8-4.4-0.50.04.5
2019 Q16.8-5.85.21.2-18.4
2019 Q29.0-6.0-2.37.8-0.1
2019 Q311.9-7.0-6.612.410.9
2019 Q46.5-6.11.77.0-3.6
2020 Q15.8-7.17.2-1.9-7.3
2020 Q28.9-10.13.5-4.118.1
2020 Q39.8-7.1-0.17.2-1.5
2020 Q46.7-9.38.85.5-13.2
2021 Q13.0-8.818.5-11.9-17.0
2021 Q26.1-7.25.1-6.17.4
2021 Q35.5-8.04.0-2.415.7
2021 Q41.3-7.111.8-3.91.3
2022 Q1-0.6-2.712.9-10.1-15.4
2022 Q25.2-8.99.0-5.97.2
2022 Q36.8-8.07.7-2.3-3.3
2022 Q42.6-6.211.9-1.0-13.7
2023 Q15.3-6.612.5-6.9-23.4
2023 Q26.1-9.510.1-6.15.1
Download data as CSV
Information
Sector: 
Segment: 
Category: 
Electricity interconnection
AER reference: 
11048184
Source: 
AER; AEMO
Overview: 

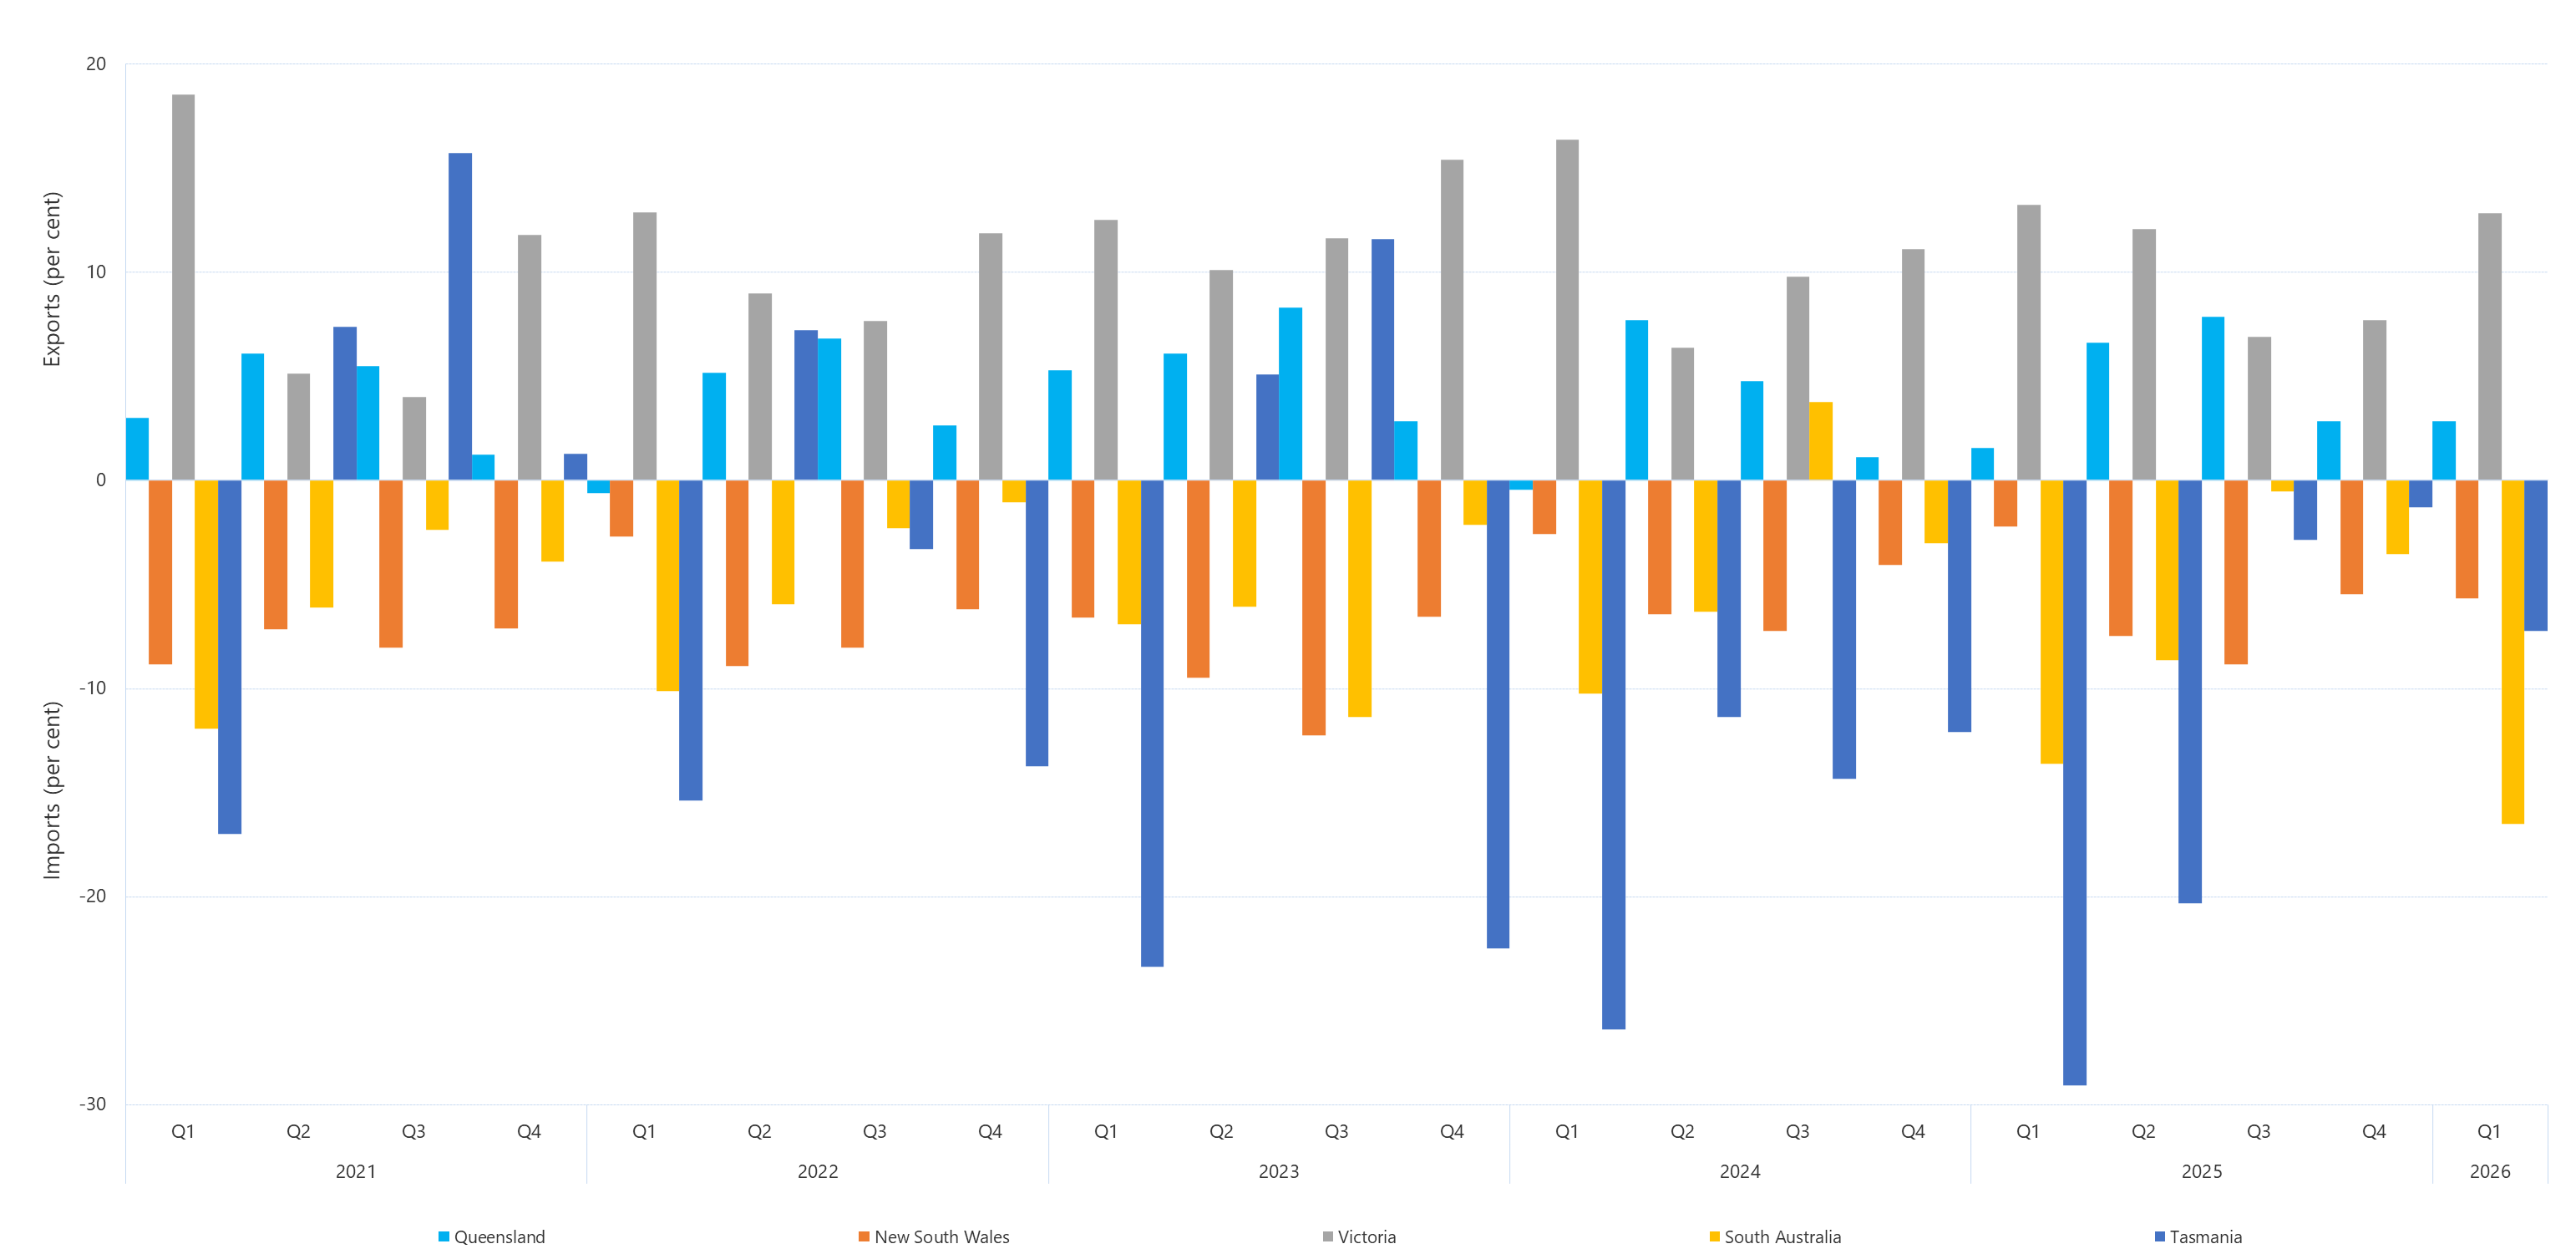
This figure presents the quarterly net trading positions of the regions in the NEM for the past five years. The data table contains more data points since 2009/10. It should be noted that the NSW and Victoria regions gained additional hydroelectric peaking capacity following the abolition of the Snowy region on 1 July 2008.