Quarterly local FCAS costs by services - Tasmania

Tabs

Graph
Data
QuarterLOWERREG ($)LOWER5MIN ($)LOWER60SEC ($)LOWER6SEC ($)RAISEREG ($)RAISE5MIN ($)RAISE60SEC ($)RAISE6SEC ($)
2010 Q10.00.00.10.10.00.00.12.4
2010 Q20.00.00.10.90.10.10.12.3
2010 Q30.00.00.00.20.00.00.00.3
2010 Q40.00.00.00.30.00.10.10.9
2011 Q10.00.00.00.10.10.10.10.6
2011 Q20.00.00.00.20.10.10.10.7
2011 Q30.00.00.00.80.10.10.00.5
2011 Q40.00.00.01.00.10.10.00.4
2012 Q10.00.10.00.00.20.30.11.2
2012 Q20.00.00.00.20.10.00.00.3
2012 Q30.00.00.00.20.00.00.00.1
2012 Q40.00.00.00.10.00.00.00.1
2013 Q10.20.00.00.80.10.00.00.6
2013 Q20.70.00.00.50.10.00.00.2
2013 Q30.30.00.00.40.00.00.00.0
2013 Q40.50.00.11.00.10.00.10.2
2014 Q11.20.00.01.50.10.00.10.3
2014 Q20.10.10.00.10.00.00.00.2
2014 Q30.00.00.00.90.10.00.00.5
2014 Q40.30.00.01.50.30.00.02.0
2015 Q10.10.00.02.30.20.00.11.2
2015 Q20.00.00.00.30.20.00.10.4
2015 Q30.10.00.00.30.20.10.00.5
2015 Q40.00.00.00.00.50.10.11.9
2016 Q10.30.00.11.10.60.00.00.8
2016 Q20.00.00.00.90.40.00.00.7
2016 Q30.00.00.00.20.20.10.01.1
2016 Q40.10.00.00.10.30.20.32.6
2017 Q10.00.00.00.01.10.10.33.4
2017 Q20.20.00.00.00.60.00.12.0
2017 Q30.10.00.00.00.40.10.12.4
2017 Q40.10.00.00.00.50.20.94.9
2018 Q10.20.00.00.00.80.20.93.9
2018 Q20.50.00.00.00.70.10.12.1
2018 Q30.20.00.00.40.10.10.10.6
2018 Q40.10.00.00.00.40.40.43.2
2019 Q10.00.00.00.00.60.61.05.7
2019 Q20.10.00.00.00.50.40.42.3
2019 Q30.90.00.00.00.60.10.51.2
2019 Q40.10.00.00.00.30.21.14.3
2020 Q10.20.00.00.10.20.11.02.6
2020 Q20.10.00.00.00.20.20.52.8
2020 Q30.20.00.11.10.40.20.42.9
2020 Q40.10.00.00.00.50.20.75.0
2021 Q10.00.00.10.20.40.11.24.7
2021 Q20.10.00.10.60.30.10.75.2
2021 Q30.10.00.31.70.30.00.72.2
2021 Q40.20.00.40.30.40.01.04.6
2022 Q10.30.00.50.50.70.31.87.2
2022 Q20.60.60.10.31.30.21.04.8
2022 Q30.60.00.20.60.90.11.54.9
2022 Q40.10.11.12.40.80.11.18.0
2023 Q10.10.10.60.30.40.00.32.4
Download data as CSV
Information
Sector: 
Segment: 
Category: 
Electricity frequency control ancillary services
AER reference: 
11048184
Source: 
AER; AEMO
Overview: 

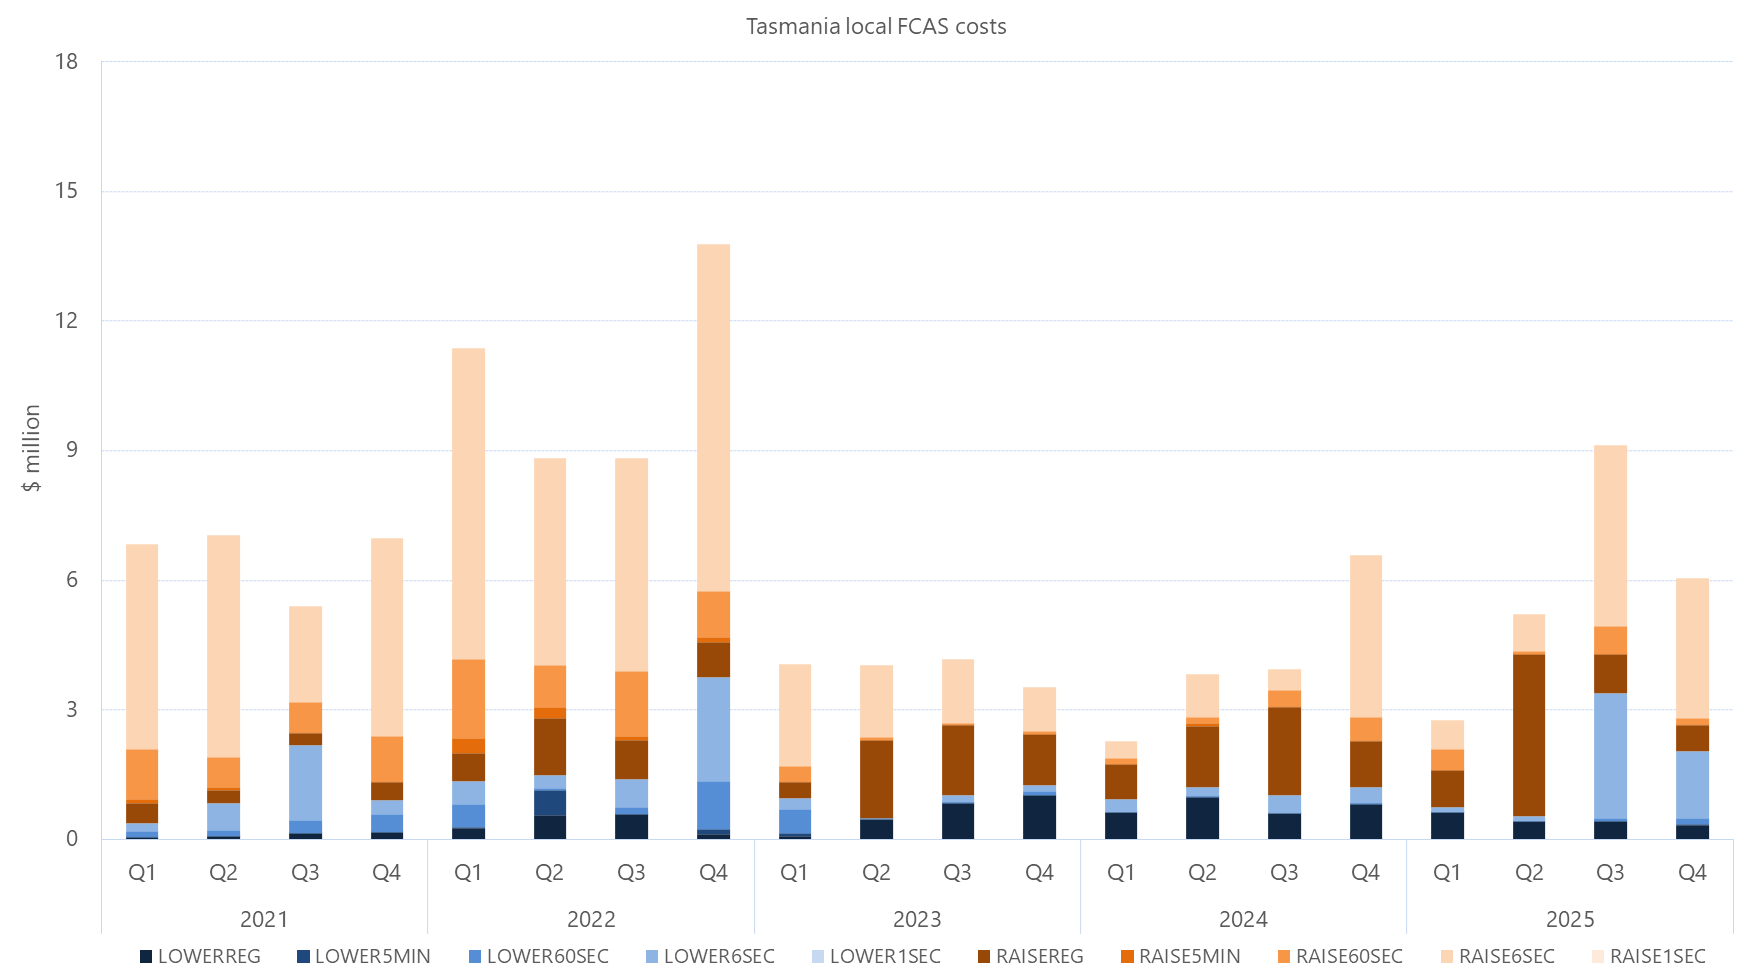
This figure shows the quarterly costs for each local FCAS service in Tasmania for the past five years. These include costs for both raise and lower regulation services, and raise and lower contingency services (fast - 6 second, slow - 60 second, delayed - 5 minute).