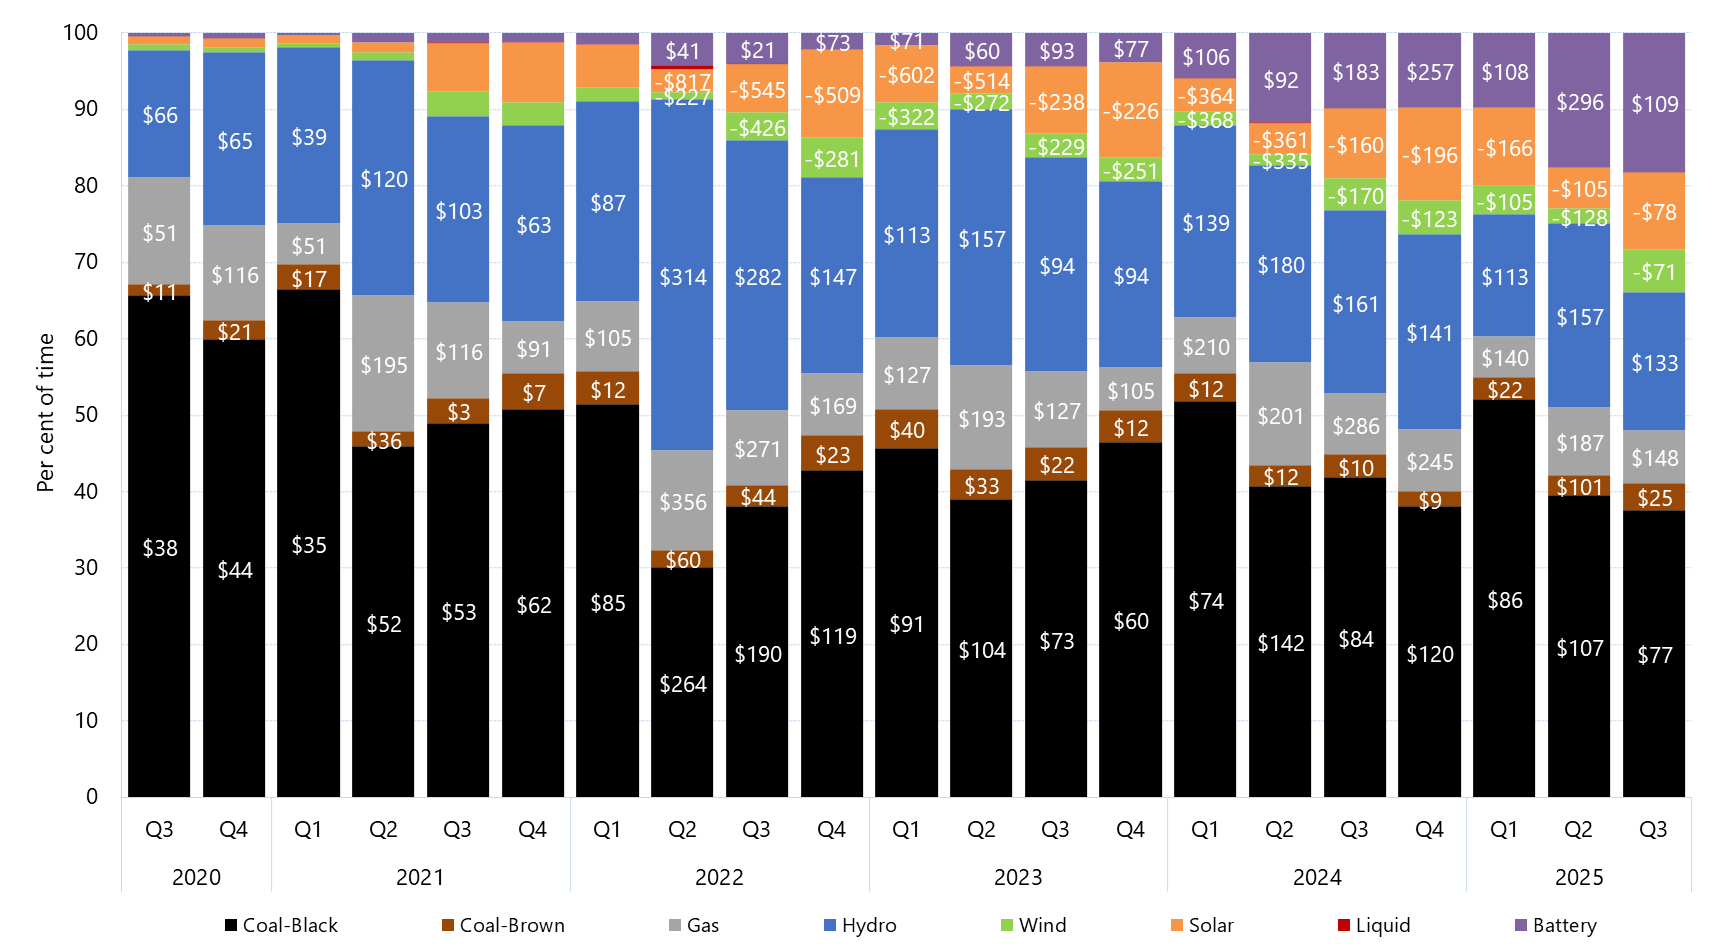
Tabs Graph Download graph Data QuarterBattery (Percent of time)Coal-Black (Percent of time)Coal-Brown (Percent of time)Gas (Percent of time)Hydro (Percent of time)Liquid (Percent of time)Solar (Percent of time)Wind (Percent of time)Battery ($ per mw hours)Coal-Black ($ per mw hours)Coal-Brown ($ per mw hours)Gas ($ per mw hours)Hydro ($ per mw hours)Liquid ($ per mw hours)Solar ($ per mw hours)Wind ($ per mw hours) 2014 Q30.0052.777.4514.9624.660.000.000.1535.7332.2140.4442.55-3.97 2014 Q40.0069.429.517.8113.260.000.000.0029.9224.4232.6141.19-26.78 2015 Q10.0067.904.977.7919.310.000.000.0329.9024.6846.2343.54-43.91 2015 Q20.0065.474.025.6424.840.000.000.0331.6230.0647.3238.77-19.93 2015 Q30.0068.682.269.2119.840.000.000.0042.8637.4355.5343.99-35.00 2015 Q40.0078.682.5310.548.110.000.000.1539.0922.2455.6355.76-153.71 2016 Q10.0068.213.9110.8616.970.000.000.0539.0628.3465.6943.87-1000.00-46.83 2016 Q20.0048.383.9226.2221.390.000.000.0949.9925.15105.98102.13-69.08 2016 Q30.0065.653.8312.3018.180.000.000.0440.7122.7795.7673.08-177.15 2016 Q40.0065.835.9211.6616.430.000.000.1558.6318.3177.4457.42-278.97 2017 Q10.0054.844.6016.8123.750.000.000.0092.1233.20138.21137.35-1000.00-517.44 2017 Q20.0060.120.9018.4120.570.000.000.0084.4741.96104.91107.73350.00 2017 Q30.0065.730.8312.6320.810.000.000.0082.7342.8995.87110.06299.25 2017 Q40.0068.450.6513.6617.240.000.000.0170.4139.0982.8497.17-515.90 2018 Q10.0269.520.5611.6418.260.000.010.00114.2365.7633.6886.4689.16349.980.00 2018 Q20.4452.201.0014.4231.900.010.000.03115.5464.2817.49103.7597.95349.990.00-11.58 2018 Q30.1951.310.7015.2232.480.000.010.09113.2862.8812.6199.66105.35-186.93-877.06 2018 Q40.1160.580.4219.1719.680.010.000.04112.9266.3125.15101.64116.26252.53-1000.00-619.59 2019 Q10.0964.890.7115.9718.290.010.020.02188.3180.4425.78104.31154.85308.15-19.24-45.85 2019 Q20.2157.190.4112.3529.710.000.110.02120.4162.7116.4697.52112.85-133.68-18.27 2019 Q30.2150.231.0420.4726.530.000.900.62161.2954.7915.4281.23126.21379.98-68.58-35.30 2019 Q40.1456.790.9218.1223.370.000.360.30156.6352.6517.9478.27100.77-97.57-43.90 2020 Q10.0560.971.1115.9221.550.000.190.211509.3347.8312.3989.4979.01-12.111583.63 2020 Q20.1561.802.3913.7620.030.000.841.03259.8636.529.3551.9952.51-13.99-0.03 2020 Q30.1965.771.4514.0216.750.001.110.71303.4437.7710.7351.2865.82379.98-5.48-10.21 2020 Q40.2260.202.5012.4522.780.001.230.63105.0243.7920.84115.8865.03379.98-271.61-104.16 2021 Q10.1166.513.325.3323.070.001.050.6069.7735.0316.8950.5139.15-856.36-133.80 2021 Q20.5646.232.0017.9330.940.001.241.10299.8152.3835.69195.31119.73-448.08-94.49 2021 Q30.5149.353.3212.6324.550.026.423.20125.3553.473.39115.52103.08350.02-570.80-118.11 2021 Q40.5251.144.756.8025.830.017.893.0682.4561.906.9491.2263.02149.60-572.06-285.22 2022 Q10.7751.794.309.2626.340.015.661.86156.4385.2711.60105.3586.99299.19-831.56-469.15 2022 Q21.5330.962.3513.3447.150.543.111.02421.20264.1359.62355.64315.26379.35-816.56-226.87 2022 Q31.4639.092.8810.0336.150.206.413.78306.13190.4843.70271.26283.83383.22-545.14-425.86 2022 Q41.0243.234.668.3025.920.0011.615.26229.76118.7323.28169.29147.44379.98-508.70-280.58 Download data as CSV Information Sector: ElectricitySegment: WholesaleCategory: Electricity market price settersAER reference: 11048184Source: AER; AEMOOverview: This figure shows the percentage of time generators of each fuel type set price in New South Wales in a given quarter, for the past five years. The data labels show the quarterly average price set by generators of major fuel-types, in $/MWh. Download:Download graphDownload data as CSV