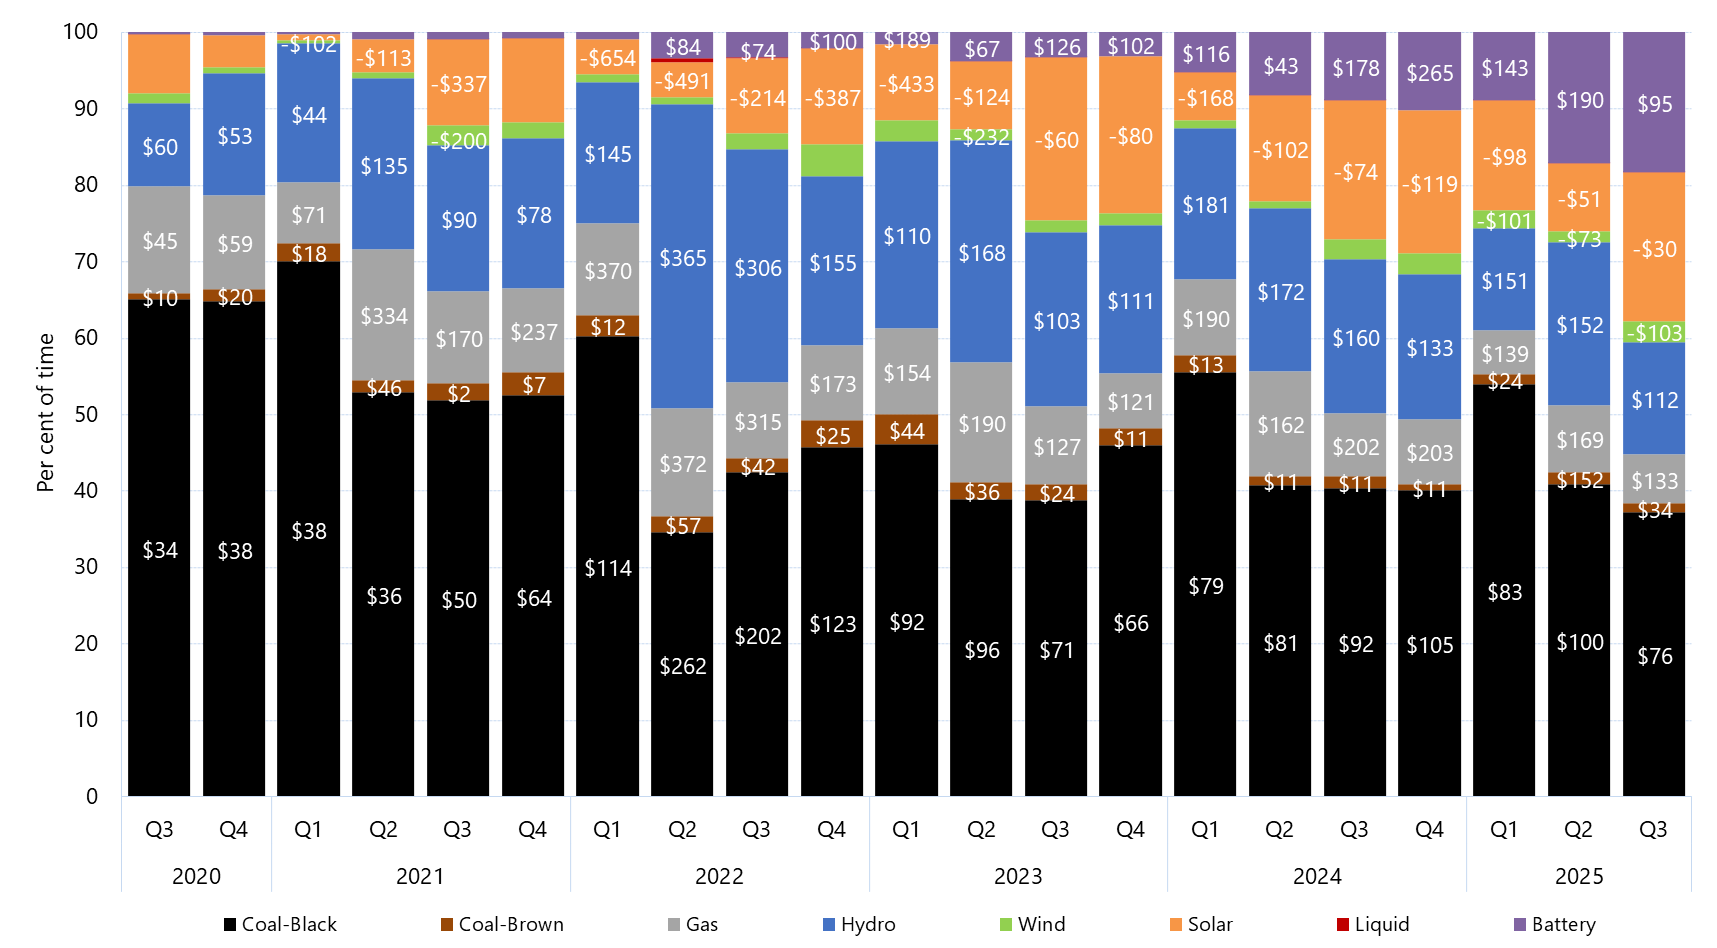
Quarterly price setter and average price set by fuel source - Queensland

Tabs

Graph
Data
QuarterBattery (Percent of time)Coal-Black (Percent of time)Coal-Brown (Percent of time)Gas (Percent of time)Hydro (Percent of time)Liquid (Percent of time)Solar (Percent of time)Wind (Percent of time)Battery ($ per mw hours)Coal-Black ($ per mw hours)Coal-Brown ($ per mw hours)Gas ($ per mw hours)Hydro ($ per mw hours)Liquid ($ per mw hours)Solar ($ per mw hours)Wind ($ per mw hours)
2014 Q30.0057.434.3322.7815.340.000.000.1230.0431.3630.0741.97-6.94
2014 Q40.0068.336.3615.2510.050.000.000.0060.5124.4733.68242.36-26.78
2015 Q10.0067.214.3412.6815.740.000.000.0377.4324.0397.80113.93-43.91
2015 Q20.0070.343.566.6719.420.000.000.0130.7128.6339.9238.28-13.52
2015 Q30.0071.511.909.7216.870.000.000.0041.5637.4962.8662.98-35.00
2015 Q40.0079.493.4710.106.880.000.000.0638.4119.0959.6358.08-22.72
2016 Q10.0070.033.8913.4612.600.000.000.0266.1526.66185.2149.66-121.75
2016 Q20.0050.424.0926.2419.160.000.000.0952.1923.51103.60102.82-69.08
2016 Q30.0068.153.1212.6216.070.000.000.0442.6722.9892.7875.76-177.15
2016 Q40.0067.674.9513.2114.080.000.000.1058.1018.2292.4265.20-30.62
2017 Q10.0056.454.1419.7319.680.000.000.00140.8632.31225.46167.21-517.44
2017 Q20.0063.940.8217.7817.450.000.000.0082.6839.28101.50107.57350.00
2017 Q30.0071.900.6911.0816.330.000.000.0075.9042.6292.95111.52299.25
2017 Q40.0074.510.5612.3812.540.000.000.0067.6743.6582.4295.11-3.10
2018 Q10.0174.550.5310.5614.340.000.010.00111.7067.0133.1992.4295.960.00
2018 Q20.2963.420.9413.0122.300.010.010.03118.7362.3617.7894.4894.68349.98-44.08-11.58
2018 Q30.1757.180.6613.5528.320.000.040.08112.6963.2512.5298.69103.82-441.70-859.49
2018 Q40.1064.860.3617.6416.950.000.060.03125.5566.7525.83101.92120.00379.98-164.75-524.49
2019 Q10.0870.900.6215.1313.210.000.040.02192.3682.1126.65101.02127.91290.19-9.62-45.35
2019 Q20.1863.540.3810.9824.220.000.670.03121.9860.6816.6795.92113.72-209.46-42.04
2019 Q30.1859.120.5415.8717.840.005.980.47159.7145.2514.8070.73119.66-73.52-175.05
2019 Q40.0963.300.7715.8617.370.002.330.28166.7450.4718.0675.7194.89-72.70-34.50
2020 Q10.0364.100.9517.3516.880.000.540.161521.3545.5111.9673.4475.74-85.143.10
2020 Q20.0566.461.9713.6813.560.003.350.94104.2633.459.4244.3847.16-45.08-35.86
2020 Q30.1365.120.8913.9110.860.007.741.35109.7533.8710.2844.5760.02379.98-26.06-4.40
2020 Q40.0865.031.6112.2416.070.004.230.7483.4737.6920.1159.4253.38-159.50-217.06
2021 Q10.1070.092.417.9518.250.000.850.3572.3638.2617.7771.3644.25-653.66-102.39
2021 Q20.4253.241.5317.2822.370.004.350.83196.0135.6046.11333.71135.52-113.20-85.07
2021 Q30.3752.222.1912.1719.160.0211.292.59119.8749.632.49170.4091.17350.02-336.77-199.96
2021 Q40.3452.902.9811.1019.600.0011.082.0086.1764.157.40236.7580.36149.60-305.21-425.26
2022 Q10.4160.692.7712.0918.390.004.631.01146.87113.5411.95370.24151.64-653.84-348.73
2022 Q21.2535.532.0214.5440.590.444.760.88531.12262.2057.20372.41368.66379.21-491.05382.20
2022 Q31.3043.361.9210.1331.000.159.982.15393.92202.3642.03314.68310.81379.99-213.52-339.30
2022 Q40.9946.233.609.9122.360.0012.644.26294.02122.5724.60172.78154.91379.98-386.79-269.30
2023 Q10.5646.613.9411.3324.700.0010.072.79620.6992.0043.80153.83109.52-433.02-306.43
2023 Q21.6239.862.2816.0529.640.039.101.43311.8296.2936.19189.85168.53379.98-124.26-231.55
Download data as CSV
Information
Sector: 
Segment: 
Category: 
Electricity market price setters
AER reference: 
11048184
Source: 
AER; AEMO
Overview: 

This figure shows the percentage of time generators of each fuel type set price in Queensland in a given quarter, for the past five years. The data labels show the quarterly average price set by generators of major fuel-types, in $ per megawatt hour.