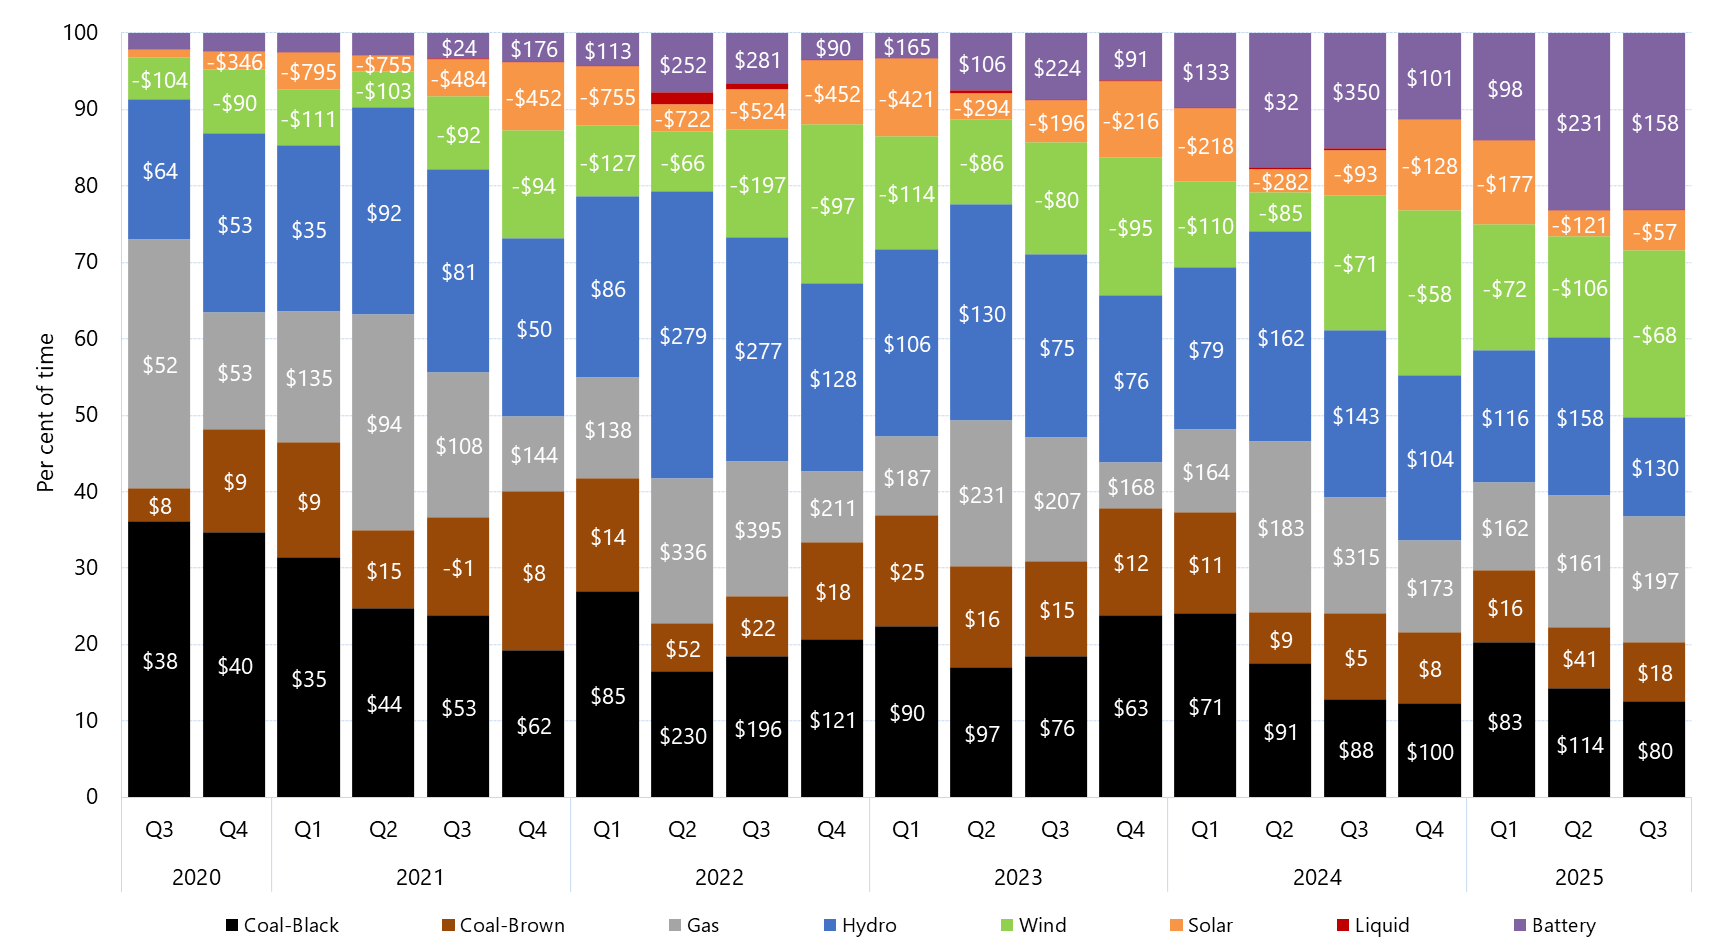
Quarterly price setter and average price set by fuel source - South Australia

Tabs

Graph
Data
QuarterBattery (Percent of time)Coal-Black (Percent of time)Coal-Brown (Percent of time)Gas (Percent of time)Hydro (Percent of time)Liquid (Percent of time)Solar (Percent of time)Wind (Percent of time)Battery ($ per mw hours)Coal-Black ($ per mw hours)Coal-Brown ($ per mw hours)Gas ($ per mw hours)Hydro ($ per mw hours)Liquid ($ per mw hours)Solar ($ per mw hours)Wind ($ per mw hours)
2014 Q30.0033.9917.6720.8222.840.000.004.6835.1932.8661.9141.77-11.32
2014 Q40.0045.7727.6914.1310.570.000.001.8429.2521.6040.9837.75-19.52
2015 Q10.0043.2429.5312.6914.040.000.000.4928.9719.4151.6735.80-28.35
2015 Q20.0039.6323.3315.2520.540.000.001.2530.5922.9793.6735.55-33.80
2015 Q30.0035.9016.7532.3614.430.000.000.5635.6442.5993.3542.64-36.69
2015 Q40.0047.7717.6523.978.040.000.002.5736.5525.5373.3564.20-969.01-38.08
2016 Q10.0046.1319.9818.9114.750.000.000.2337.2823.4682.9441.09247.77-102.10
2016 Q20.0033.5220.8328.6015.530.010.001.5148.0114.66119.7296.78323.26-66.26
2016 Q30.0035.6714.5536.2212.700.030.000.8338.5615.39210.4163.281063.98-77.76
2016 Q40.0031.7826.6222.6317.360.010.001.6152.2615.70107.9142.15-1000.00-24.38
2017 Q10.0034.5819.6324.3620.980.050.000.4072.5427.90198.95113.99-831.25-64.54
2017 Q20.0031.151.4636.1130.920.030.000.3385.8940.60116.07108.93376.73-64.98
2017 Q30.0036.526.0526.8329.560.010.001.0382.9836.01103.35111.80316.17-87.75
2017 Q40.0136.564.1932.9425.610.010.000.69165.0170.8135.1982.6795.14393.71-187.38
2018 Q10.2040.681.7828.9127.980.070.000.36835.2665.6232.44175.8293.65361.990.00-202.76
2018 Q21.0739.845.0223.2430.610.100.000.12121.1861.7316.67116.7394.76448.43-124.00
2018 Q30.6134.6710.4324.3427.140.140.282.39432.5762.127.83112.3296.571347.64-951.68-542.15
2018 Q40.3541.631.2133.7622.520.050.040.45110.0066.4525.54108.45110.89182.90-1000.00-308.00
2019 Q10.2837.942.2831.0827.880.130.120.29780.1979.5367.78163.63153.40495.20-284.85-126.25
2019 Q20.2828.331.7833.1234.960.010.101.41124.0061.4311.0899.51109.50253.32-435.06-126.07
2019 Q30.4925.822.3736.5928.470.021.145.10157.0152.206.8082.34115.04379.98-183.06-191.26
2019 Q40.5240.393.3827.4121.850.081.145.23126.6150.6512.01105.4391.426960.85-277.33-234.95
2020 Q10.4538.026.0229.8619.280.211.174.993.4944.628.68104.9358.78283.70-155.42-56.82
2020 Q20.2444.347.7720.4924.130.000.722.32167.8836.516.8451.3647.34-70.66-58.98
2020 Q30.5636.714.4333.0918.650.010.995.5626.9737.797.8752.5064.14379.98-171.67-104.33
2020 Q40.6735.3513.6615.5823.790.012.358.5945.2340.418.9853.2652.88253.32-345.54-90.09
2021 Q10.8731.9115.2717.5222.060.094.827.46175.7135.029.20135.3334.976183.52-795.33-110.75
2021 Q21.0125.2810.4328.7727.570.012.094.85225.0544.3315.2593.5291.78379.99-754.88-103.19
2021 Q31.1924.3713.0919.4327.070.055.049.7693.4452.86-0.77107.5781.34341.30-483.54-92.48
2021 Q41.5719.6421.3110.0823.750.139.0514.47456.3761.887.99143.9350.171534.84-451.80-94.23
2022 Q11.6627.6915.1313.5324.300.147.939.62374.4085.0713.86138.2786.581367.93-754.88-127.01
2022 Q23.0217.346.6619.9439.541.533.818.16952.39229.9451.69335.85279.57537.28-722.20-66.11
2022 Q32.6819.198.2418.4330.480.795.5314.67902.91196.0222.49394.50277.89448.09-524.35-197.26
2022 Q41.4121.1712.939.4825.090.078.6421.21231.12120.6318.21211.41128.032441.81-452.26-96.81
2023 Q11.1522.9014.7710.5525.100.0910.4215.02548.6189.9225.23186.68105.581593.63-420.95-114.26
2023 Q23.2517.7813.8720.0329.530.423.4311.69435.7997.1715.88231.48130.08465.55-294.26-86.48
Download data as CSV
Information
Sector: 
Segment: 
Category: 
Electricity market price setters
AER reference: 
11048184
Source: 
AER; AEMO
Overview: 

This figure shows the percentage of time generators of each fuel type set price in South Australia in a given quarter, for the past five years. The data labels show the quarterly average price set by generators of major fuel-types, in $/MWh.