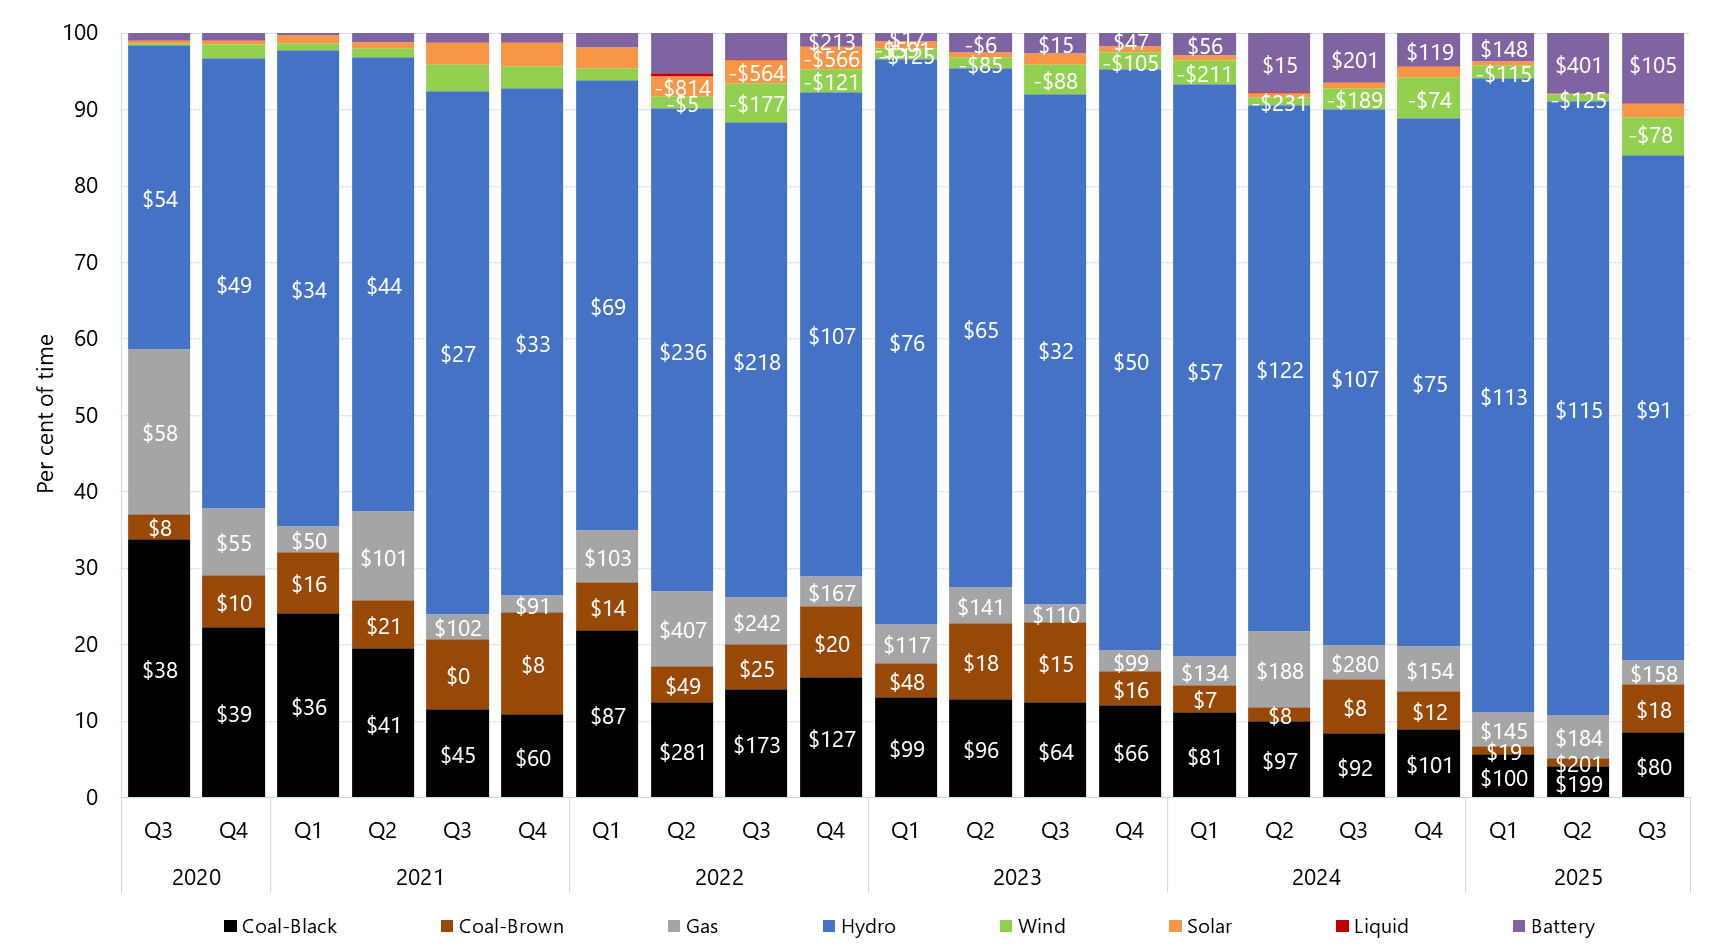
Tabs Graph Download graph Data QuarterBattery (Percent of time)Coal-Black (Percent of time)Coal-Brown (Percent of time)Gas (Percent of time)Hydro (Percent of time)Liquid (Percent of time)Solar (Percent of time)Wind (Percent of time)Battery ($ per mw hours)Coal-Black ($ per mw hours)Coal-Brown ($ per mw hours)Gas ($ per mw hours)Hydro ($ per mw hours)Liquid ($ per mw hours)Solar ($ per mw hours)Wind ($ per mw hours) 2014 Q30.0027.5411.7311.8848.700.000.000.1436.0129.3141.2037.031.51 2014 Q40.0019.508.473.9867.930.000.000.1331.8222.5333.1943.53-22.77 2015 Q10.0015.778.374.3471.430.000.000.0931.6718.4651.0141.68-41.34 2015 Q20.0028.5311.144.8355.260.000.000.2432.1518.3951.2237.21-34.93 2015 Q30.0040.1910.658.7440.380.000.000.0436.6724.2458.7339.47-36.78 2015 Q40.002.270.421.1596.120.000.000.0344.6246.2394.4579.79-35.00 2016 Q10.000.000.000.00100.000.000.000.00176.57 2016 Q20.005.811.835.7086.630.000.000.0354.0031.73124.07122.97-177.06 2016 Q30.0040.6915.6410.4633.060.000.000.1640.6316.42104.6064.12-37.95 2016 Q40.0032.6327.618.3430.920.000.000.5051.6116.1771.3242.10-48.84 2017 Q10.0011.234.6411.0673.050.000.000.0198.0727.20112.04102.31350.00-1000.00-199.11 2017 Q20.0021.431.2018.9058.460.010.000.0086.0542.15116.94120.07350.00 2017 Q30.0029.805.4814.1850.520.000.000.0183.8736.60102.34104.99350.00-47.19 2017 Q40.0128.163.3018.7449.770.000.000.01165.0171.5035.6885.0991.05590.57-636.93 2018 Q10.0918.350.3715.6865.490.010.000.01444.1569.8730.5496.8189.21349.99-536.44 2018 Q20.056.520.982.6589.790.000.000.00110.9762.1624.65105.2776.32349.99-1000.00 2018 Q30.0719.847.684.9167.330.000.010.1680.6059.5910.1798.7535.87-686.93-364.41 2018 Q40.1933.540.8322.5342.810.020.010.06135.2466.6323.07106.5385.30192.60-1000.00-464.02 2019 Q10.1816.850.6014.2068.060.040.060.03244.1287.64-11.72125.94136.77221.88-205.39-302.09 2019 Q20.2121.561.0217.5759.570.000.050.02118.5562.2510.12104.66105.09379.98-53.00-8.44 2019 Q30.1815.391.6312.1470.290.000.180.19267.8053.587.8691.0166.83379.98-170.10-202.59 2019 Q40.1731.421.8713.7652.220.000.200.36135.2951.079.0078.9786.47-216.76-218.58 2020 Q10.0726.292.0511.9759.030.000.050.54118.7545.4111.4358.1244.1053.78-6.95 2020 Q20.1235.625.9211.8243.860.000.372.2993.2336.397.0252.9730.48-6.36-4.40 2020 Q30.3334.093.2621.6439.950.010.370.36116.1938.468.4357.9054.25379.98-15.23-2.79 2020 Q40.3022.446.918.7959.240.000.531.7882.2639.0010.0854.7249.40379.98-345.0310.95 2021 Q10.1124.267.963.4262.390.000.990.8756.5435.9115.9249.9933.90-916.91-99.51 2021 Q20.4119.686.4211.6459.890.000.751.21124.2340.8020.78101.3944.00-840.95-150.32 2021 Q30.3711.779.193.2968.920.012.883.5887.1044.93-0.20101.7626.58353.05-628.38-81.83 2021 Q40.4011.0713.432.1766.820.003.152.9555.7960.187.9991.4133.37149.60-598.16-125.17 2022 Q10.7722.236.266.8659.430.002.821.63123.1286.7014.47103.2468.81-815.89-241.67 2022 Q21.7812.954.9410.1365.410.402.751.64596.85280.9649.03406.70235.96949.28-813.67-5.46 2022 Q31.1414.565.976.3163.610.143.045.23241.50172.6924.55242.02218.02379.99-563.65-177.32 2022 Q40.8515.979.274.0463.800.012.943.12511.42127.4620.13167.01107.09379.98-566.14-121.35 2023 Q10.4413.224.525.1874.190.000.941.51138.0898.5347.72116.9276.29-591.13-124.99 2023 Q20.8413.1610.134.7269.020.000.611.53149.4295.7017.98141.5064.85-572.66-85.48 Download data as CSV Information Sector: ElectricitySegment: WholesaleCategory: Electricity market price settersAER reference: D19/178617Source: AER; AEMOOverview: This figure shows the percentage of time generators of each fuel type set price in Tasmania in a given quarter, for the past five years. The data labels show the quarterly average price set by generators of major fuel-types, in $/MWh. Download:Download graphDownload data as CSV