Quarterly price setter and average price set by fuel source - Victoria

Tabs

Graph
Data
QuarterBattery (Percent of time)Coal-Black (Percent of time)Coal-Brown (Percent of time)Gas (Percent of time)Hydro (Percent of time)Liquid (Percent of time)Solar (Percent of time)Wind (Percent of time)Battery ($ per mw hours)Coal-Black ($ per mw hours)Coal-Brown ($ per mw hours)Gas ($ per mw hours)Hydro ($ per mw hours)Liquid ($ per mw hours)Solar ($ per mw hours)Wind ($ per mw hours)
2014 Q30.0038.4518.2815.4227.520.000.000.3435.7828.0841.0541.55-0.57
2014 Q40.0046.8030.898.6713.340.000.000.3029.9820.0133.2638.03-21.66
2015 Q10.0040.5332.608.2318.430.000.000.2130.2016.8245.1438.20-82.90
2015 Q20.0042.6722.366.2128.410.000.000.3431.5818.0047.8536.22-35.52
2015 Q30.0048.9216.7510.7423.540.000.000.0536.5922.7059.1742.30-37.71
2015 Q40.0050.4623.6013.9211.700.000.000.3239.0617.5863.5066.48-47.94
2016 Q10.0049.9121.9311.0916.960.000.000.1139.0021.7899.6945.79-142.41
2016 Q20.0033.1923.7323.5818.250.000.001.2451.0315.34106.31100.33-84.90
2016 Q30.0048.1318.7713.3819.390.000.000.3340.8216.53104.3968.88-74.55
2016 Q40.0031.7137.158.7721.420.000.000.9652.3015.8874.0538.41-48.31
2017 Q10.0031.1324.9717.1526.710.000.000.0480.0327.79114.78117.53350.00-1000.00-172.44
2017 Q20.0034.381.6028.6535.370.010.000.0085.8739.73114.72108.22350.00
2017 Q30.0038.276.7121.2033.800.010.000.0184.9436.25104.25111.38316.17-82.02
2017 Q40.0139.144.5427.2629.030.010.000.02165.0171.1435.0387.2695.36590.57-604.62
2018 Q10.1543.051.9024.0830.780.030.000.021026.6666.1531.98155.5493.47349.990.00-243.07
2018 Q20.6541.165.3018.0734.680.040.000.10113.3862.7216.7195.8995.421487.49-97.39
2018 Q30.2536.0512.1217.3633.850.000.010.3594.6763.808.17100.9998.34379.98-186.93-455.96
2018 Q40.2843.341.3630.8923.910.040.010.16142.1766.6523.81109.99110.91286.29-1000.00-253.41
2019 Q10.2639.722.3727.2430.170.080.100.07832.7580.2764.48162.76148.42219.78-157.15-92.51
2019 Q20.3130.281.9625.8041.530.010.060.06124.9162.2010.91101.29108.84379.98-119.55-131.93
2019 Q30.3629.222.6829.7036.200.010.910.92210.6053.037.5390.43115.80379.99-82.37-84.03
2019 Q40.2744.743.8622.4327.100.000.561.04263.9351.9911.6385.6195.15380.00-121.41-105.12
2020 Q10.1544.938.2619.2325.500.000.291.642230.1245.608.90115.87118.34-23.94-22.07
2020 Q20.2046.138.2917.2125.550.000.691.92208.6536.836.8254.0547.30-16.79-13.01
2020 Q30.3842.156.2326.7722.170.010.981.31208.9837.887.3458.5763.84379.98-14.80-30.00
2020 Q40.4037.1316.3612.5527.010.002.294.2572.8638.818.2556.0255.66379.98-485.88-70.90
2021 Q10.2237.8119.634.8327.270.005.754.4949.8335.3510.0652.2634.93-903.66-133.00
2021 Q20.7727.5512.2321.6431.400.002.254.16265.6544.0014.40105.4292.48-787.93-110.14
2021 Q30.7425.8614.8415.2231.130.025.117.08116.6553.08-0.53110.6380.83379.98-577.09-76.94
2021 Q40.9322.0325.395.9627.530.019.718.4373.2261.327.4093.1549.15224.39-564.23-155.85
2022 Q11.0429.8617.838.8727.010.0110.045.33130.6184.3612.09117.7884.86299.19-818.46-252.40
2022 Q22.4718.608.5914.3346.850.824.473.86427.25242.6139.77259.75276.97382.49-795.23-88.41
2022 Q32.1521.6610.7711.1237.780.345.7410.45309.19197.7821.98282.59279.72381.84-613.03-247.77
2022 Q41.2821.7117.666.1329.130.0110.5113.56110.75116.8216.32173.38128.42379.98-539.09-136.31
2023 Q10.8123.6416.878.0427.440.0010.9512.26186.8389.7222.88116.72106.10-498.20-144.54
2023 Q22.4319.4918.6812.0636.240.043.497.56163.71100.4015.31164.13130.53379.98-482.31-120.36
Download data as CSV
Information
Sector: 
Segment: 
Category: 
Electricity market price setters
AER reference: 
11048184
Source: 
AER; AEMO
Overview: 

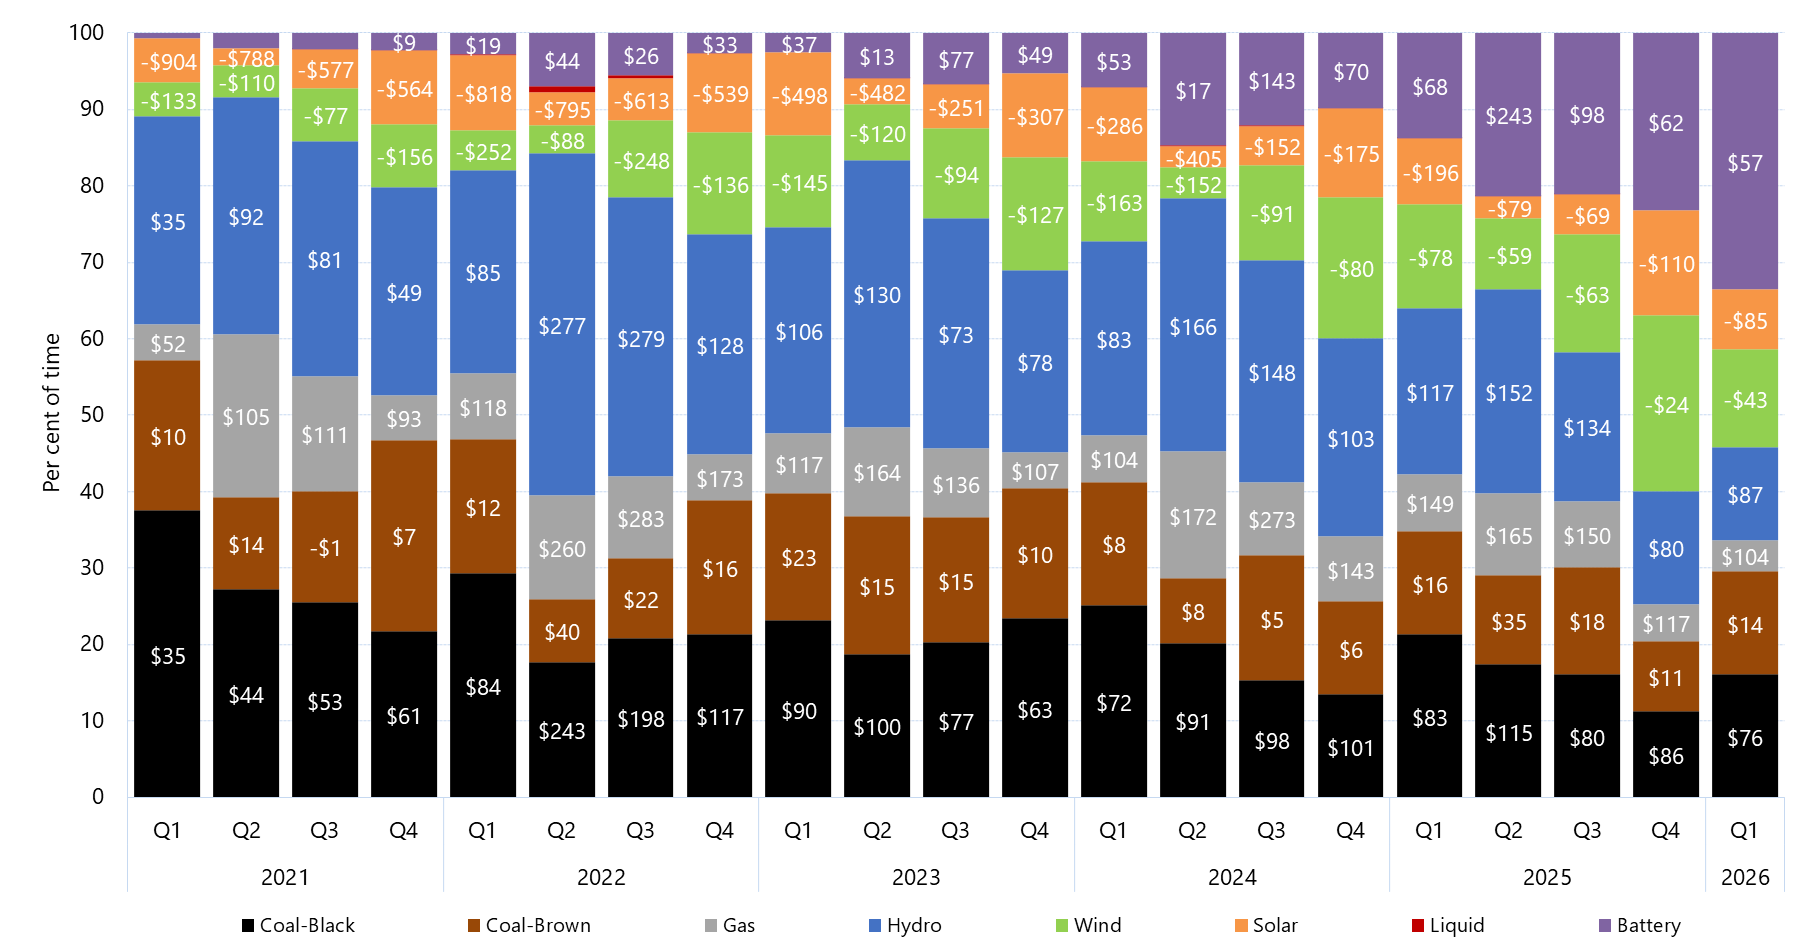
This figure shows the percentage of time generators of each fuel type set price in Victoria in a given quarter, for the past five years. The data labels show the quarterly average price set by generators of major fuel-types, in $/MWh.