Quarterly settlement residues and settlement residue auction proceeds

Tabs

Graph
Data
Quarter endingTotal residue ($ million)Auction proceeds ($ million)
2004 Q29.3516.52
2004 Q318.4220.13
2004 Q4143.6314.54
2005 Q151.1549.57
2005 Q218.7020.94
2005 Q316.2922.80
2005 Q4112.5224.58
2006 Q179.7247.47
2006 Q214.3823.40
2006 Q333.7030.10
2006 Q417.1237.54
2007 Q167.5359.67
2007 Q2111.0723.24
2007 Q316.7230.40
2007 Q420.4931.53
2008 Q1115.2864.04
2008 Q216.8221.85
2008 Q311.6717.68
2008 Q454.1535.14
2009 Q183.1259.12
2009 Q213.9915.63
2009 Q311.5617.16
2009 Q4145.7828.00
2010 Q155.4455.88
2010 Q214.0016.32
2010 Q320.5417.50
2010 Q418.4232.15
2011 Q1102.2046.63
2011 Q26.6917.63
2011 Q312.5821.25
2011 Q416.4329.15
2012 Q17.8143.54
2012 Q29.6016.85
2012 Q313.2119.40
2012 Q420.6026.57
2013 Q122.4235.60
2013 Q241.2516.55
2013 Q313.5818.38
2013 Q420.6020.92
2014 Q118.6627.09
2014 Q29.6815.70
2014 Q327.9016.36
2014 Q428.8416.80
2015 Q135.9522.37
2015 Q227.8515.66
2015 Q336.5416.77
2015 Q419.4219.42
2016 Q132.9927.70
2016 Q240.0125.15
2016 Q344.2927.30
2016 Q491.1231.64
2017 Q1131.4246.61
2017 Q227.0837.22
2017 Q339.0639.71
2017 Q432.4941.52
2018 Q135.8862.25
2018 Q239.0149.43
2018 Q339.2946.56
2018 Q424.6841.79
2019 Q1101.88103.42
2019 Q223.1540.47
2019 Q355.1140.89
2019 Q455.6536.61
2020 Q1128.0748.09
2020 Q223.2333.03
2020 Q333.2634.45
2020 Q459.1831.82
2021 Q137.5546.23
2021 Q214.7928.49
2021 Q352.0832.31
2021 Q474.7633.62
2022 Q171.1452.23
2022 Q2159.1737.69
2022 Q3162.4044.87
2022 Q496.5056.63
Download data as CSV
Information
Sector: 
Segment: 
Category: 
Electricity interconnection
AER reference: 
11048184
Source: 
AER; AEMO
Overview: 

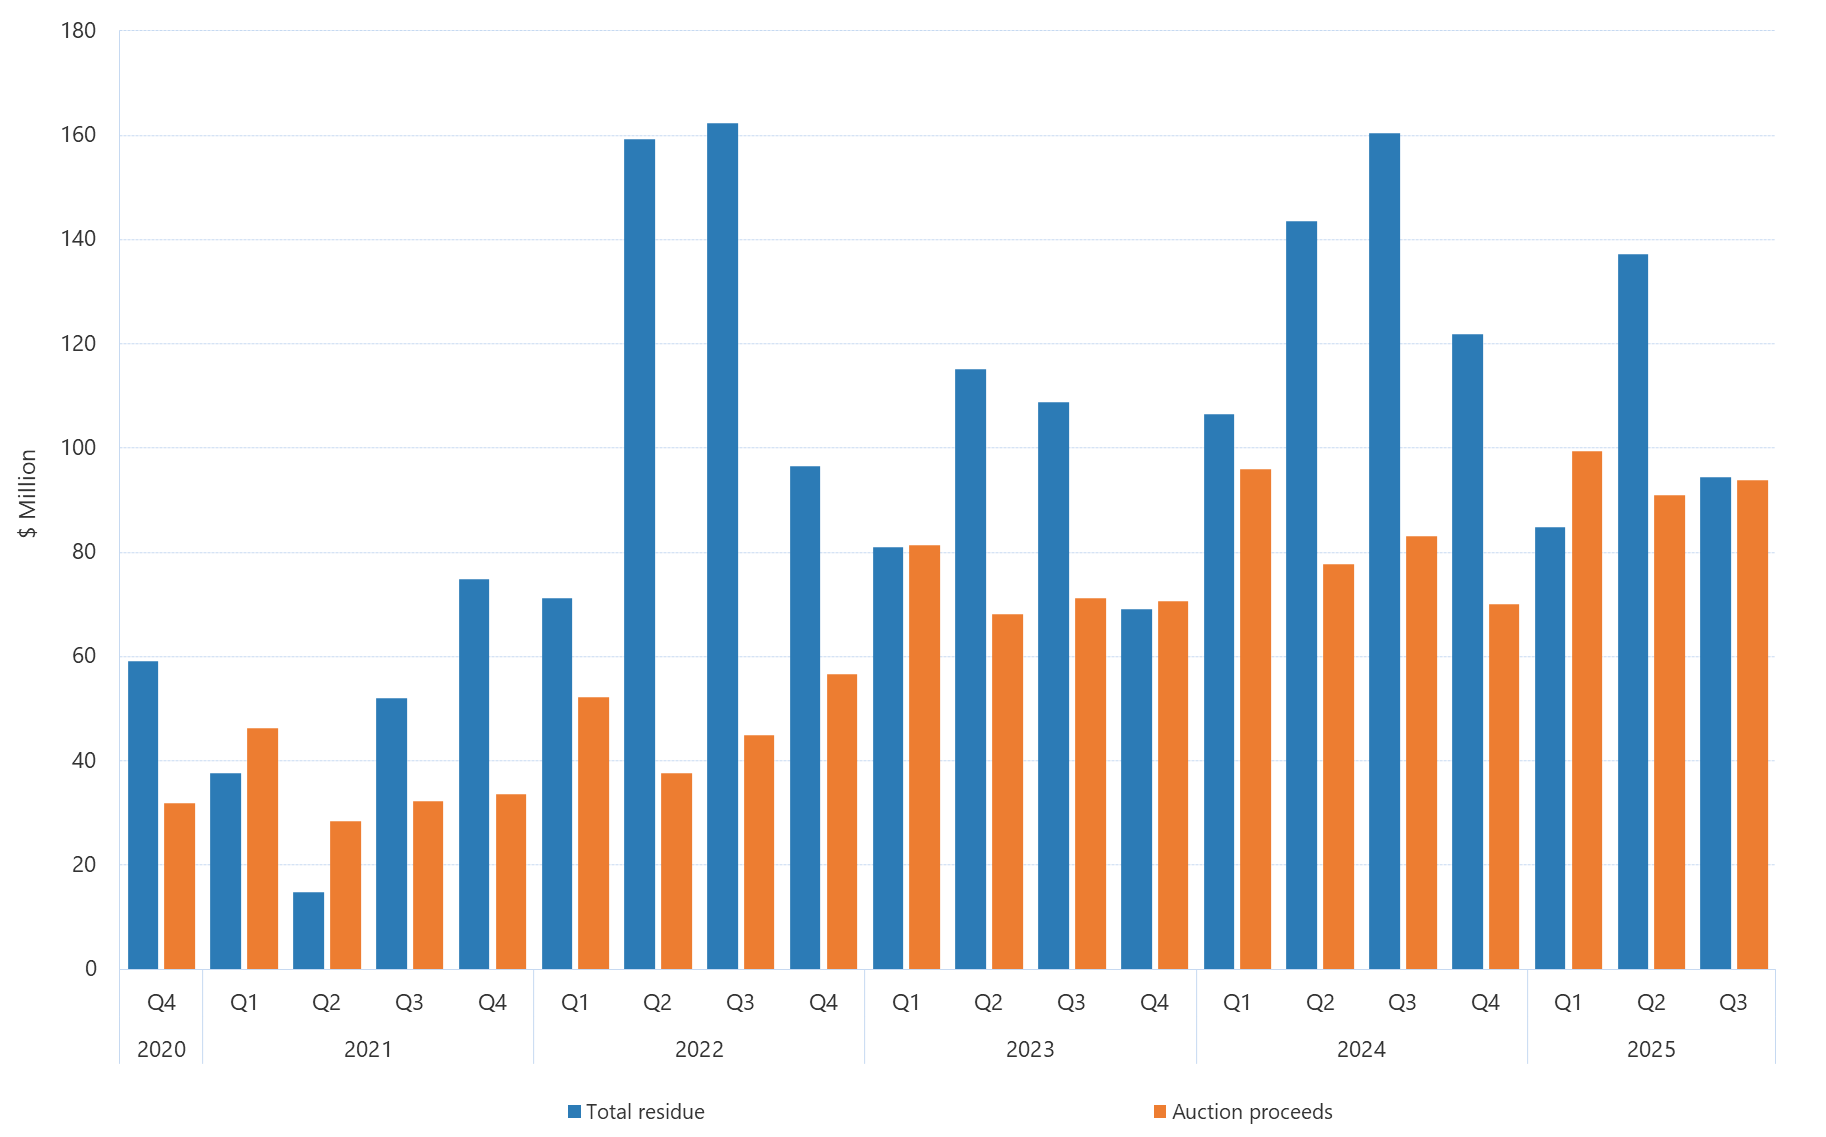
Price separation creates risks for parties that contract across regions. The difference between the price paid in the importing region and the price received in the importing region, multiplied by the amount of flow, is called a settlement residue. AEMO holds quarterly auctions to sell the rights to future residues as a risk management strategy. This figure presents the amount of settlement residues accrued each quarter against the proceeds of residue auction for the past five years. The data table contains data since Q2 2004. This data is always one quarter behind.