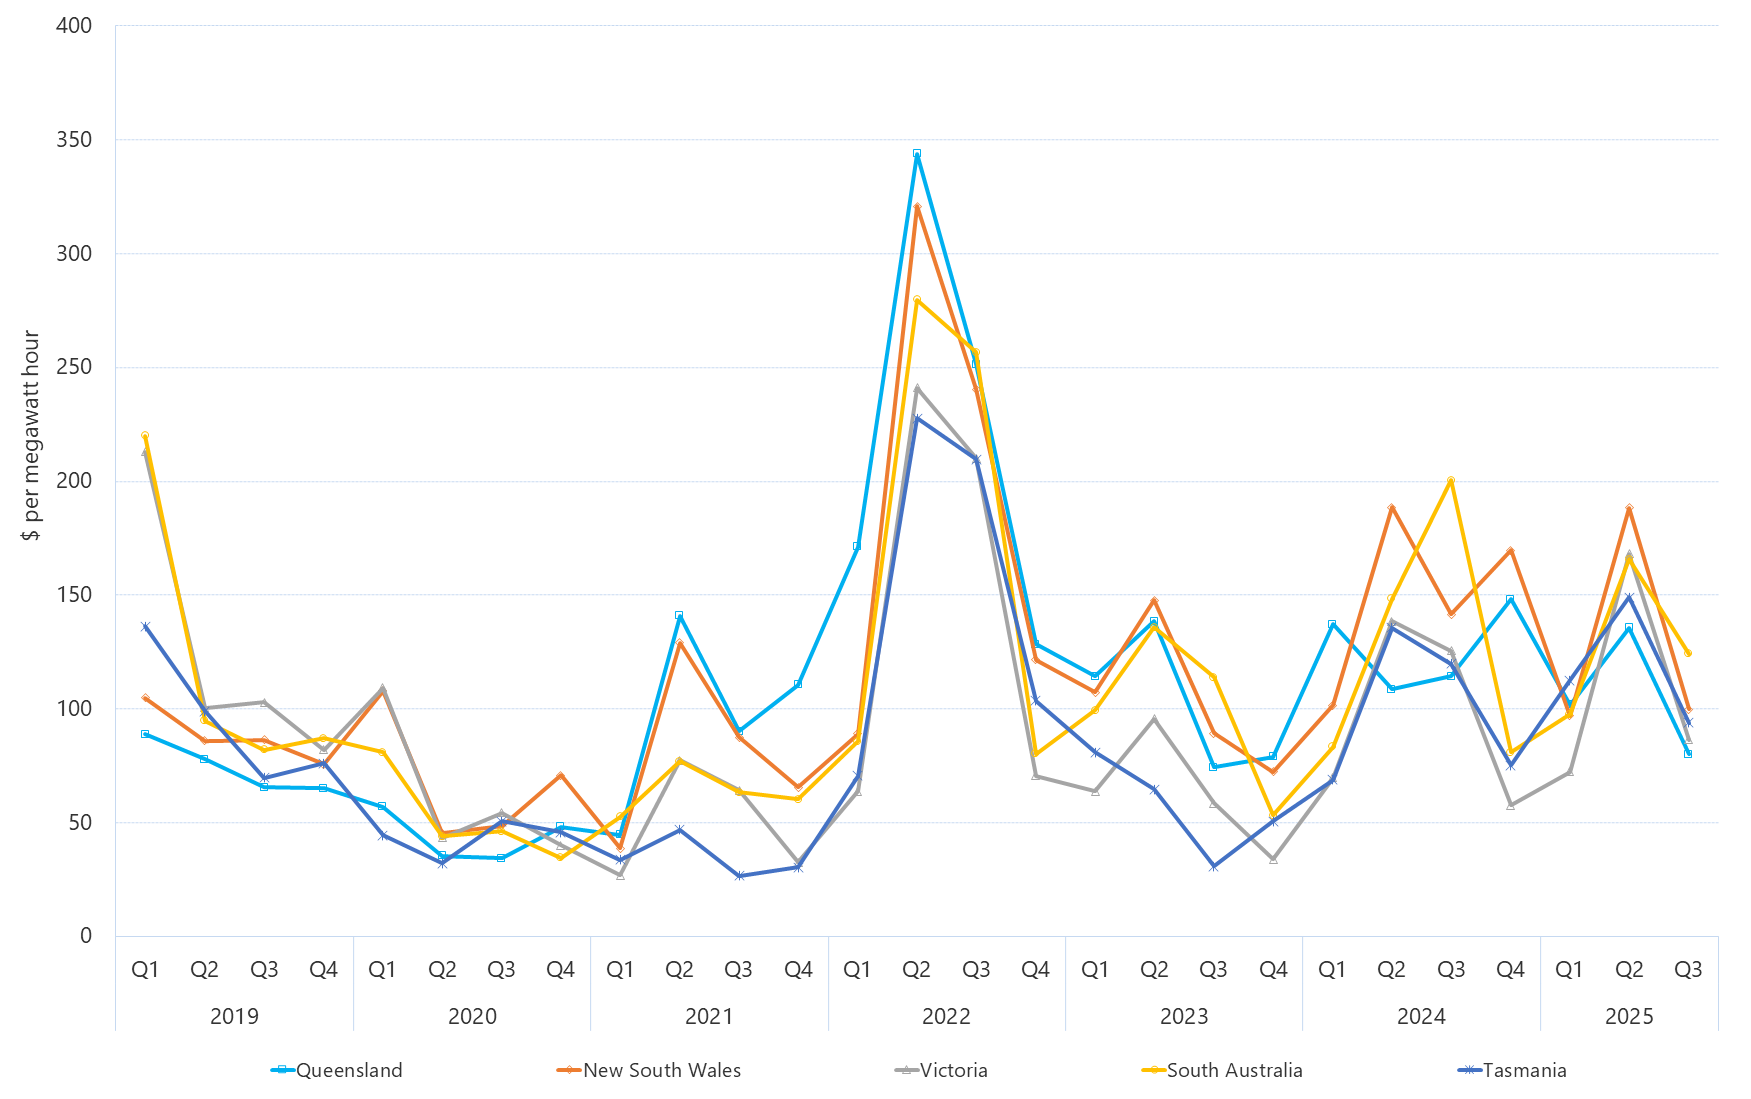
Quarterly volume weighted average spot prices - regions

Tabs

Graph
Data
Quarter endingQueensland ($ per megawatt hour)New South Wales ($ per megawatt hour)Victoria ($ per megawatt hour)South Australia ($ per megawatt hour)Tasmania ($ per megawatt hour)
1999 Q193212561
1999 Q231292950
1999 Q332252353
1999 Q428191877
2000 Q177352990
2000 Q258424154
2000 Q344495460
2000 Q443273656
2001 Q1565272109
2001 Q234343236
2001 Q327302728
2001 Q431282827
2002 Q135282729
2002 Q258664950
2002 Q354433840
2002 Q464392832
2003 Q123332430
2003 Q225332828
2003 Q328332326
2003 Q420212433
2004 Q145603064
2004 Q229333134
2004 Q327312836
2004 Q448903854
2005 Q125352231
2005 Q223282736
2005 Q322293034100
2005 Q43973324763
2006 Q13845535733
2006 Q22528303838
2006 Q32639394342
2006 Q42327294037
2007 Q16057756950
2007 Q2119146998374
2007 Q35659606265
2007 Q45641444644
2008 Q181345024354
2008 Q23842474661
2008 Q33641424244
2008 Q43951343244
2009 Q137438716155
2009 Q232353435106
2009 Q32628252724
2009 Q4531002913431
2010 Q146526713427
2010 Q22230483440
2010 Q32230262941
2010 Q42123192321
2011 Q16590418327
2011 Q22628303232
2011 Q32931303730
2011 Q43032253330
2012 Q13126262837
2012 Q23033333035
2012 Q35860636950
2012 Q45755676047
2013 Q110552576451
2013 Q260565710647
2013 Q36056557047
2013 Q45955507141
2014 Q17151647841
2014 Q25150485339
2014 Q33240384836
2014 Q46833283240
2015 Q110735284039
2015 Q23237324834
2015 Q34546396938
2015 Q44345435980
2016 Q189465054174
2016 Q277816987114
2016 Q354565313355
2016 Q46666357538
2017 Q11941358516099
2017 Q28794107118114
2017 Q3829510310297
2017 Q47381888585
2018 Q1727412014491
2018 Q272888610177
2018 Q38090849543
2018 Q4858810010085
2019 Q189105213220136
2019 Q278861019599
2019 Q366861038270
2019 Q46576828776
2020 Q1571081098144
2020 Q23545434432
2020 Q33449544651
2020 Q44871403546
2021 Q14539275334
2021 Q2141129777747
2021 Q39088646327
2021 Q411165336030
2022 Q117189648671
2022 Q2344321241280228
2022 Q3251240210257210
2022 Q41281217080103
2023 Q1114107649981
2023 Q21391489613665
Download data as CSV
Information
Sector: 
Segment: 
Category: 
Electricity spot prices
AER reference: 
11048184
Source: 
AER; AEMO
Overview: 

This figure presents the quarterly volume weighted average spot electricity prices in each region of the NEM for the past five years. The average is weighted against demand for electricity. The data table contains more data points since the commencement of the NEM.