Victorian gas market average daily weighted prices by quarter

Tabs

Graph
Data
Quarter EndingAverage daily weighted imbalance price ($ per gigajoule)
30/09/20083.01
31/12/20083.26
31/03/20092.93
30/06/20092.68
30/09/20091.71
31/12/20091.44
31/03/20101.80
30/06/20102.40
30/09/20102.34
31/12/20101.30
31/03/20112.70
30/06/20113.48
30/09/20113.31
31/12/20112.43
31/03/20123.26
30/06/20124.12
30/09/20125.03
31/12/20124.04
31/03/20134.35
30/06/20134.53
30/09/20134.08
31/12/20133.87
31/03/20143.90
30/06/20143.65
30/09/20143.64
31/12/20143.33
31/03/20153.48
30/06/20154.08
30/09/20154.68
31/12/20154.25
31/03/20164.31
30/06/20166.74
30/09/20168.83
31/12/20166.86
31/03/20179.11
30/06/20179.55
30/09/20178.57
31/12/20176.36
31/03/20188.94
30/06/20188.29
30/09/20189.43
31/12/20189.80
31/03/20199.74
30/06/20199.72
30/09/20198.43
31/12/20197.50
31/03/20205.72
30/06/20204.65
30/09/20204.56
31/12/20205.52
31/03/20215.52
30/06/20217.25
30/09/202110.10
31/12/202110.00
31/03/20229.48
30/06/202228.83
30/09/202224.40
31/12/202217.44
31/03/202311.52
30/06/202313.86
Download data as CSV
Information
Sector: 
Segment: 
Category: 
Gas prices
AER reference: 
D11/2298801[V6]
Source: 
AER; AEMO
Overview: 

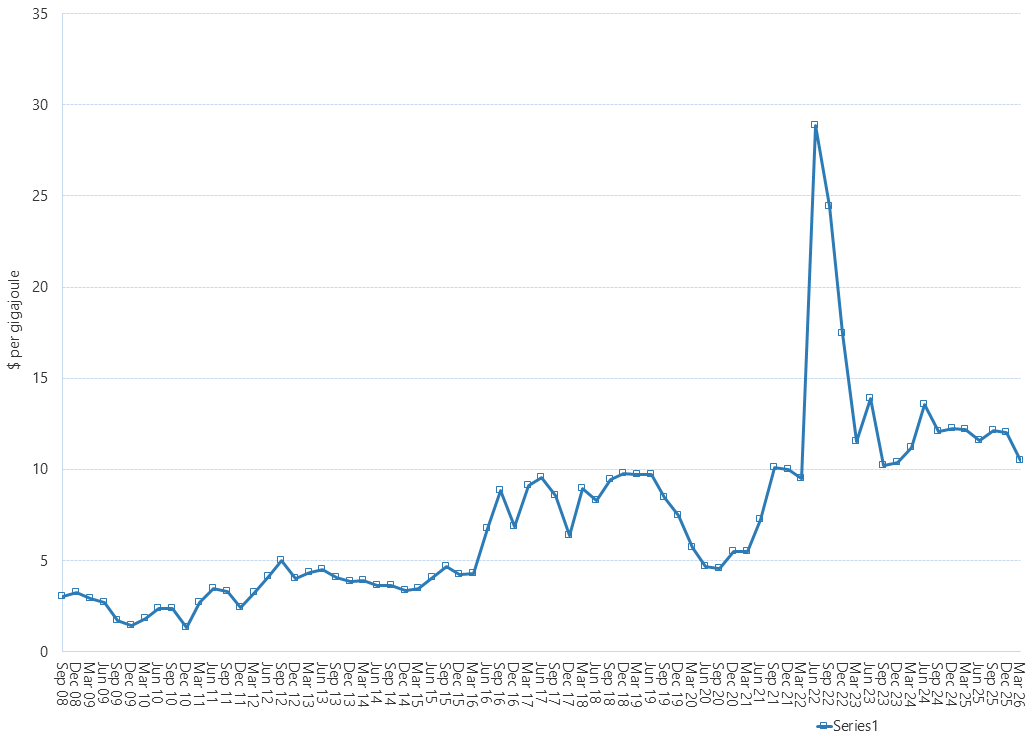
This figure shows average daily prices* by quarter for the Victorian Gas Market.
* These are Imbalance weighted prices that use (forecast) imbalance volumes and prices for the five schedules each day