Wallumbilla Gas Supply Hub - monthly trade activity by participant

Tabs

Graph
Data
Month endingTotal (Number of participants trading)Buyers (Number of participants trading)Sellers (Number of participants trading)
31/03/2014532
30/04/2014664
31/05/2014532
30/06/2014542
31/07/2014745
31/08/2014532
30/09/2014543
31/10/2014756
30/11/2014655
31/12/2014774
31/01/2015868
28/02/2015655
31/03/2015968
30/04/2015974
31/05/2015644
30/06/20151189
31/07/20151159
31/08/20151098
30/09/20151068
31/10/2015965
30/11/2015857
31/12/2015969
31/01/2016986
29/02/2016967
31/03/2016867
30/04/20161168
31/05/2016975
30/06/2016955
31/07/20161199
31/08/201610710
30/09/2016974
31/10/2016966
30/11/201611610
31/12/201612811
31/01/20171178
28/02/201711810
31/03/20171189
30/04/20171096
31/05/20171189
30/06/201710810
31/07/20171098
31/08/20171088
30/09/201710910
31/10/2017101010
30/11/201711910
31/12/20171179
31/01/20181087
28/02/201811910
31/03/2018121111
30/04/20181099
31/05/2018111011
30/06/20181199
31/07/201811910
31/08/2018121110
30/09/2018121211
31/10/2018111110
30/11/201811118
31/12/2018121112
31/01/2019131212
28/02/2019131311
31/03/2019131211
30/04/201914139
31/05/2019141313
30/06/2019121211
31/07/201912128
31/08/2019121110
30/09/2019121111
31/10/2019121111
30/11/2019131112
31/12/2019131213
31/01/2020161612
29/02/2020151511
31/03/2020151411
30/04/2020131013
31/05/2020131211
30/06/202012119
31/07/202014149
31/08/2020141412
30/09/2020151412
31/10/2020131113
30/11/2020141413
31/12/2020161215
31/01/2021151315
28/02/2021161511
31/03/2021151314
30/04/2021151513
31/05/2021151414
30/06/2021151514
31/07/2021181617
31/08/2021171117
30/09/2021151413
31/10/2021161513
30/11/2021171416
31/12/2021161415
31/01/2022151414
28/02/2022161615
31/03/2022171715
30/04/2022171416
31/05/2022191818
30/06/2022181617
31/07/2022171617
31/08/2022181815
30/09/2022181816
31/10/2022151415
30/11/2022181617
31/12/2022202016
31/01/2023161614
28/02/2023191916
31/03/2023191914
30/04/2023171515
31/05/2023201518
30/06/2023181317
Download data as CSV
Information
Sector: 
Segment: 
Category: 
Gas liquidity (GSH)
AER reference: 
D11/2298801[V6]
Source: 
AEMO; AER
Overview: 

Wallumbilla in Queensland is a major gas supply hub. As a pipeline interconnection point for the Surat-Bowen Basin, it links gas markets in Queensland, South Australia, New South Wales and Victoria. It services industrial gas customers, LNG export facilities and gas powered generators, making it a natural point of trade and an ideal location for a gas trading exchange.

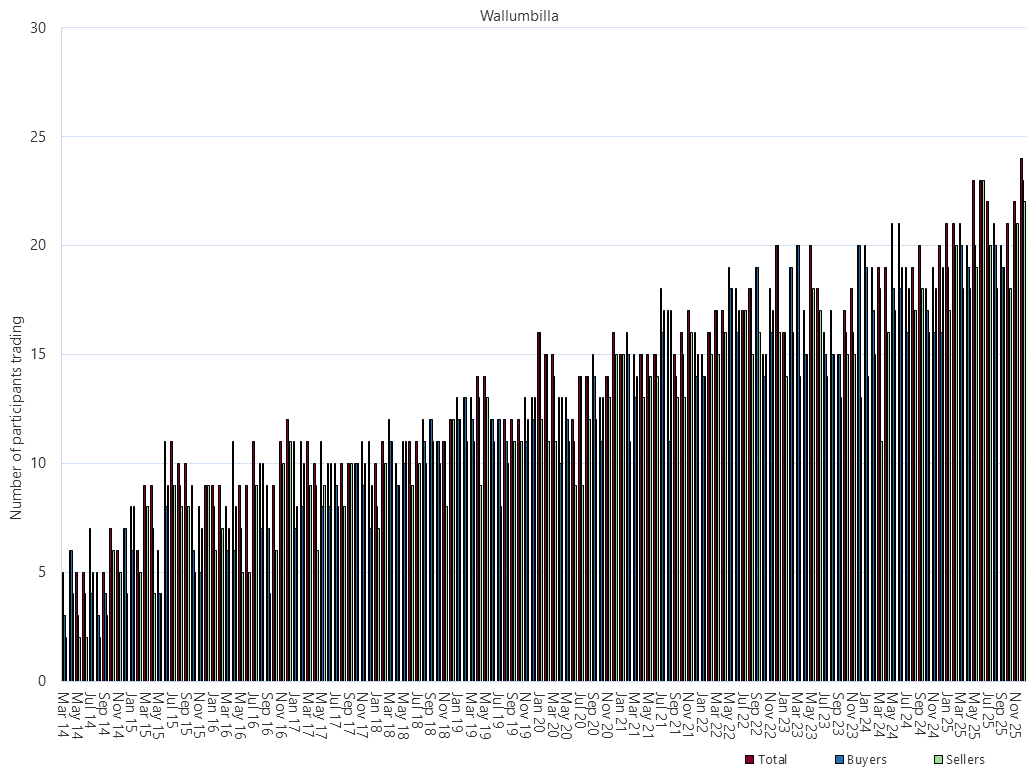
This figure is a summary of monthly trading activity in the gas supply hub by unique number of trading participants. The total number of participants trading indicates the number of unique participants who executed trades during the period. The number of buyers and sellers indicates the number of unique participants who executed trades as either the buyer or seller.