Wind output as a percentage of total output - regions

Tabs

Graph
Data
Financial yearQueensland (Percent of regional output)New South Wales (Percent of regional output)Victoria (Percent of regional output)South Australia (Percent of regional output)Tasmania (Percent of regional output)
2005-060.132.801.20
2006-070.436.601.50
2007-080.419.213.88
2008-090.010.4914.065.60
2009-100.561.9817.334.86
2010-110.732.0121.774.13
2011-120.992.4327.494.45
2012-131.123.6827.773.80
2013-141.265.1334.787.41
2014-151.935.2336.8310.81
2015-162.875.9537.6810.27
2016-172.876.4343.1810.49
2017-183.158.6343.019.96
2018-190.615.6410.3344.239.87
2019-201.517.1112.6645.9511.82
2020-212.757.7215.6748.9417.64
2021-223.259.3619.3355.3515.33
2022-23 (YTD)3.469.7921.3360.2717.08
Download data as CSV
Information
Sector: 
Segment: 
Category: 
Electricity generation
AER reference: 
11048184
Source: 
AER; AEMO
Overview: 

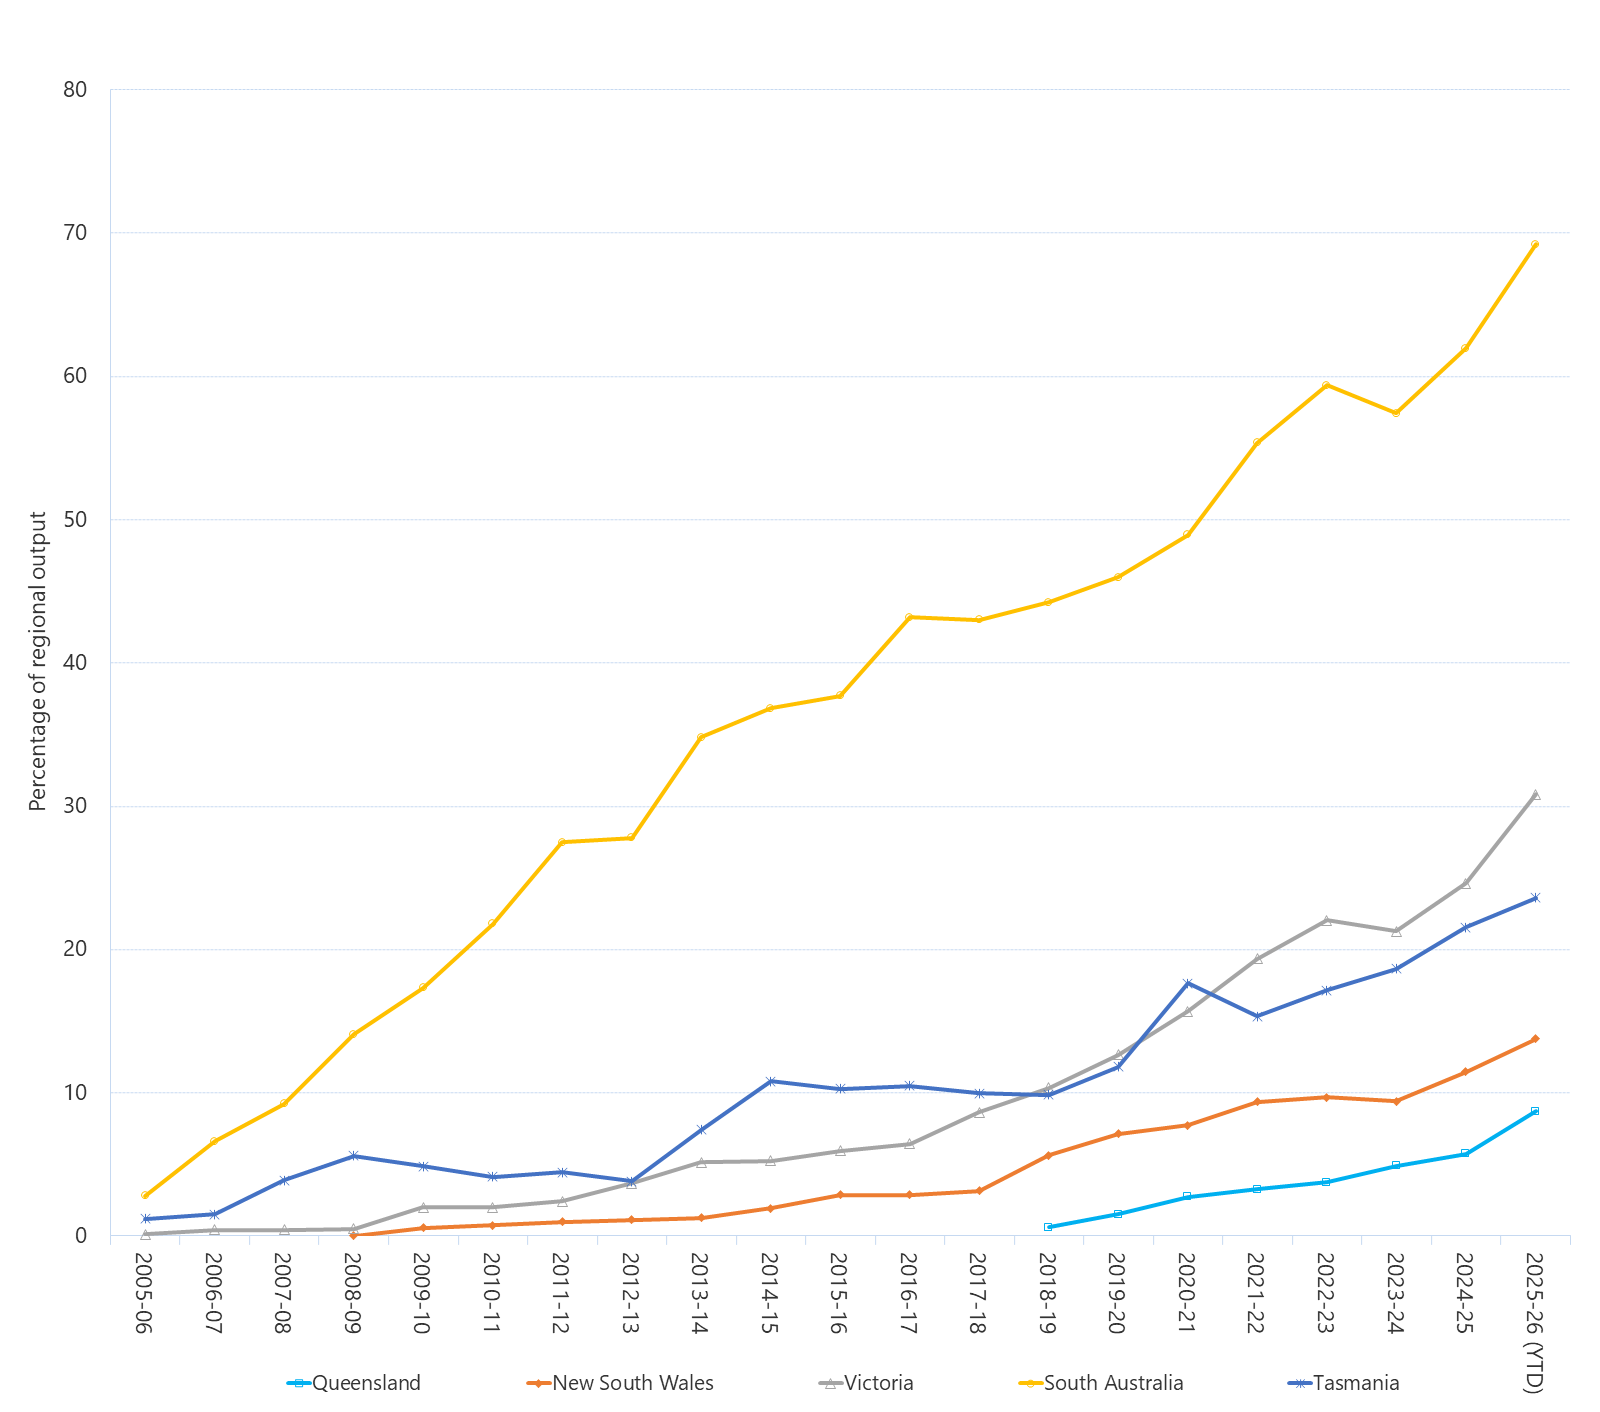
This figure shows the percentage of output wind contributes to total output in each region since 2005-06.